
The average U.S. pest control company spends about 6.6% of revenue on marketing and advertising, according to the 2025 Pest Control Industry Cost Study from NPMA and PCO Bookkeepers (246 firms, $584 million in combined revenue). That's about $66,000 a year, or $5,500 a month, at $1M in revenue. Use it as a starting point, then adjust: spend more while you're opening towns or building a recurring book, less when routes are full or you can't tell which channel booked the job. Judge every dollar by cost per new recurring customer, not cost per lead.
"How much should I spend on marketing?" is one of the first questions pest control owners ask. Most answers are a single percentage with no source, or a sales pitch dressed as a benchmark. This guide starts with the one benchmark built from pest control companies' own books, explains its limits, and then shows how to build a budget from your own numbers: the calls you need, what they cost, what a plan customer is worth and how the season changes all of it.
You won't find our prices here. A marketing budget should come from your revenue, margins, markets and goals, not from what any one agency charges.
The pest control benchmark: 6.6% of revenue
Pest control companies spend about 6.6% of revenue on marketing and advertising on average. That figure comes from the 2025 Pest Control Industry Cost Study by the National Pest Management Association and PCO Bookkeepers, released in December 2025. It covers 246 firms with $584 million in combined revenue across six U.S. regions, so it reflects real pest control P&Ls rather than small businesses in general.
The same study gives the context you need to read that 6.6%:
| Benchmark (2025 cost study) | Industry average | What it means for your budget |
|---|---|---|
| Marketing and advertising | 6.6% of revenue | The typical spend. Growth-stage companies usually sit above it. |
| Recurring revenue | 74% of revenue | Most income comes from plans, so a new plan customer is worth years of revenue, not one visit. |
| Gross margin | 58% | The margin to use in your lifetime value math below. |
| Operating profit margin | 15% | Every extra point of marketing has to earn its way back out of this. |
| Revenue growth | 9.5% year over year | If you're growing much faster than this, expect to spend above the average. |
Here's 6.6% by revenue, with a growth range of 8–10% for companies actively adding towns or offices. This is plain arithmetic on the percentages:
| Annual revenue | 6.6% a year | Per month at 6.6% | Growth range (8–10%) per month |
|---|---|---|---|
| $500,000 | $33,000 | $2,750 | $3,333 – $4,167 |
| $1,000,000 | $66,000 | $5,500 | $6,667 – $8,333 |
| $2,000,000 | $132,000 | $11,000 | $13,333 – $16,667 |
| $3,000,000 | $198,000 | $16,500 | $20,000 – $25,000 |
| $5,000,000 | $330,000 | $27,500 | $33,333 – $41,667 |
You'll also see 7–8% of gross revenue quoted for small businesses in general. Investopedia attributes it to the SBA for businesses under $5M with 10–12% net margins, though we couldn't find the figure in the SBA's own marketing and sales guide. It lands close to the pest control average, which is a useful cross-check, but the NPMA figure is the better benchmark because it comes from pest control companies' own books.
Two limits to keep in mind. An average blends startups, mature firms and companies that count door-to-door commissions differently, so it says what's typical, not what's right for you. And below roughly $250,000 in revenue, 6.6% is under $1,400 a month, which won't fund much paid advertising. At that size, put time into the free channels first: your Google profile, reviews after every first service, and pages for the pests and towns you serve.
When should you spend more or less than the average?
Spend above 6.6% when you have spare technician capacity and proven unit economics, and below it when more leads would be wasted. Use this table to place yourself:
| Spend more when... | Spend less when... |
|---|---|
| You're entering a new city or opening a new office | Your schedule is already full and you can't hire technicians fast enough |
| You're adding a service line, like termite or mosquito | Your office books too few of the calls you already get |
| You have spare route capacity in the towns you're targeting | You can't yet tell which channel produced a job |
| You have a proven cost per new plan customer and good retention | Your margins are thin |
| A competitor has sold, slowed down or left the market | Plan cancellations are high, so new customers leave quickly |
| Termite swarm season or spring ant calls are about to start | It's your slowest month and demand isn't there to buy |
Growing companies often spend above the average for a period, because they're building rankings, reviews and locations that keep paying off later. Mature companies with full routes and strong map rankings often spend less.
Build your budget from the calls you need
A percentage tells you what's typical. Your own numbers tell you what's needed. Work backward from your goal:
- Set the goal in new recurring customers and one-time jobs for the year.
- Work out booked jobs needed. Include enough new customers to replace those who cancel.
- Work out leads needed. Divide booked jobs by your lead-to-booked rate. If your office books half of qualified calls, you need twice as many calls as jobs.
- Estimate cost per lead by channel from your own tracking. Use the last full year if you have it.
- Multiply leads needed by cost per lead for each channel you plan to use.
- Add fixed costs: website, software, call tracking, agency or staff time.
- Compare with the benchmark. If your number is far above 6.6% of revenue, look at close rate and retention before cutting the goal. If it's far below, you may be underinvesting in growth.
The formula in one line: budget = (booked jobs needed ÷ lead-to-booked rate) × cost per lead + fixed costs.
Why pest control can afford more per customer
Pest control is a recurring-revenue business. A customer on a quarterly or bi-monthly plan pays you again and again, and often adds termite, mosquito or rodent work later. That changes the math:
| Metric | Formula |
|---|---|
| Annual value of a plan customer | Plan price × visits per year, plus average add-on services |
| Average customer lifetime | 1 ÷ annual cancellation rate (for example, 25% cancelling a year means about four years) |
| Lifetime value | Annual value × average lifetime × gross margin |
| Affordable cost per new plan customer | A share of lifetime value you're comfortable investing, after you know your payback period |
A worked example, with made-up plan numbers you should replace with your own: a quarterly plan at $135 a visit is $540 a year. At a 25% annual cancellation rate the average plan lasts about four years, and at the industry's 58% gross margin that's roughly $1,250 in gross profit per plan customer before add-ons. If one in three plan customers later buys a termite or mosquito service, the number climbs from there. Against that, spending a few hundred dollars to win a plan customer can be a good trade, while the same spend on a one-time wasp call usually isn't.
Plug in your own plan prices and cancellation rate. Most owners who do this find that a customer acquisition cost that looks expensive against one visit looks reasonable against several years of service. That's also why the recurring plan offer on every first visit is one of the best "marketing" investments you can make, and why retention belongs in the budget conversation. More on converting one-time callers in our lead generation guide.

Where should a pest control marketing budget go?
There's no single right split. A practical approach: start with the channels that bring calls fastest, keep the ones that compound running, and move money toward whatever shows the lowest cost per booked job in your own tracking.
| Channel | What it does | When to lean on it |
|---|---|---|
| Google Business Profile and local SEO | Map pack and organic calls that compound over time | Always on. For most of our pest control clients, it's the largest call source. |
| Reviews | Drives map rank and close rate | On every job, starting now. Costs time more than money. |
| Local Services Ads | Pay-per-lead calls at the top of Google, with the Google Verified badge | From day one if you qualify, harder in busy season |
| Google Search ads | Targeted calls by pest and town | Where the profile isn't strong yet, for high-value services and new markets |
| Website | Turns searches and ads into calls | A periodic investment, with ongoing pages for pests and towns |
| Door-to-door | Recurring plan sales in targeted neighborhoods | If you can recruit, train and manage a team |
| Meta and retargeting | Brings back people who visited but didn't call, and seasonal awareness | Once you have steady site traffic |
| Direct mail, door hangers, print | Neighborhood reach | Targeted around existing routes, with its own tracking number |
| Tracking and software | Call tracking, CRM source tagging, review tools | Before you scale any spend |
For context, a Scorpion survey of nearly 1,000 home services professionals found 75% invest in digital advertising, 42% in print, 41% in out-of-home and only 37% in SEO. Most home service companies are renting visibility with ads rather than building it. For pest control, where most calls start on Google, that's an opening.
How to budget for Local Services Ads
Local Services Ads charge per lead, not per click, and lead costs vary a lot by market, service and competition. Termite leads usually cost more than general pest leads, and big metro markets usually cost more than small towns. Rather than relying on a national average, start with a modest budget, track your actual cost per lead and booked rate for a few weeks, then scale.
- Dispute invalid leads. Google may credit leads that are outside your service area, for services you don't offer, or spam. Review them weekly.
- Answer every call. Missed calls can still be charged and hurt your ranking.
- Plan for the 2026 changes. Google is moving Local Services Ads into Google Ads as pay-per-lead campaigns, starting in August 2026 with pest control in the first group. Weekly budgets become daily budgets (your weekly figure divided by seven), and monthly spend is capped at the daily average times 30.4. Manual maximum cost-per-lead bids go away, and separate targets for different services under one campaign are merged into one campaign-level Target CPA. If you need termite leads bid differently from general pest, plan on separate campaigns, and reset the daily budget to the monthly amount you actually intend to spend divided by 30.4 (Google's migration notes).
The details are in our Google Ads and LSA guide.
What counts as marketing spend?
To compare honestly with the benchmark, count everything:
- Ad spend on Google, Local Services Ads, Meta and any other platform.
- Agency, freelancer and consultant fees.
- Marketing staff payroll, including part of an office manager's time if they run reviews and social.
- Website hosting, development and design.
- Software: call tracking, CRM marketing features, review and email tools.
- Print, direct mail, door hangers and truck wraps.
- Door-to-door sales commissions and recruiting, if you treat them as acquisition cost.
- Sponsorships, events and association memberships.
- Referral rewards.
Door-to-door is worth thinking about separately. Many owners count it as sales, not marketing. Either is fine, as long as you're consistent and compare cost per customer across channels the same way.
The line items most budgets forget
Tracking and software
Tracking is the cheapest part of a marketing budget and the one that makes the rest measurable. A basic setup for a pest control company includes:
- Call tracking with separate numbers for the Google profile, website, ads and print, and call recording to review how calls are handled.
- A required lead source field in your CRM, filled in for every new customer.
- Google Analytics and Search Console, owned by your company.
- Map grid rank tracking for your main keywords in each market.
- A review request tool, or a simple automated text from your CRM after each service.
Without these, you can't tell which part of the budget is working, so every other number on this page becomes a guess.
The website
Treat the website as a periodic investment with ongoing additions, not a one-time expense. Budget for:
- A refresh every few years, or sooner if the site is slow, hard to use on phones, or looks dated.
- New pages through the year for pests, towns, commercial industries and seasonal guides.
- Hosting, security and maintenance.
- Speed and mobile fixes, since most pest control searches happen on phones.
A full rebuild isn't always needed. In Bodhi's audit of a $107K/month pest control company, the site looked "like it's from 2015," and the recommendation was a modern front end and better local targeting rather than starting over. See our pest control website design guide.
Reviews and reputation
Reviews cost mostly time: technicians asking on every job, someone sending the follow-up text and someone replying to every review. Budget that time explicitly, because it's one of the highest-return activities in pest control marketing. Our best-performing clients get 25 new reviews/month. Never budget for buying reviews or rewarding customers for them. Google bans it, and the FTC's rule on fake reviews can bring penalties. See our Google reviews guide.
Photos and video
Real photos of your team, trucks and work make your Google profile and website more convincing. A technician's phone is enough for most of it. Some companies budget for a professional shoot every year or two for the website and team pages, and rely on technician photos week to week.
Be careful comparing your percentage with others
When owners compare marketing budgets at industry events or online, the numbers often aren't comparable:
- Some count door-to-door commissions as marketing, some don't. That alone can swing the percentage a lot.
- Some leave out staff time and software, so their percentage looks low.
- Growth stage matters. A company opening two new offices this year should spend a higher share than one defending a mature market.
- Market costs differ. Ad leads in a big metro can cost far more than in a small town.
- Margins differ. A company with strong margins can afford a higher share than one with thin margins.
The better comparison is with yourself: cost per booked job and cost per new plan this year vs. last year, by channel and location.
How should the budget change through the year?
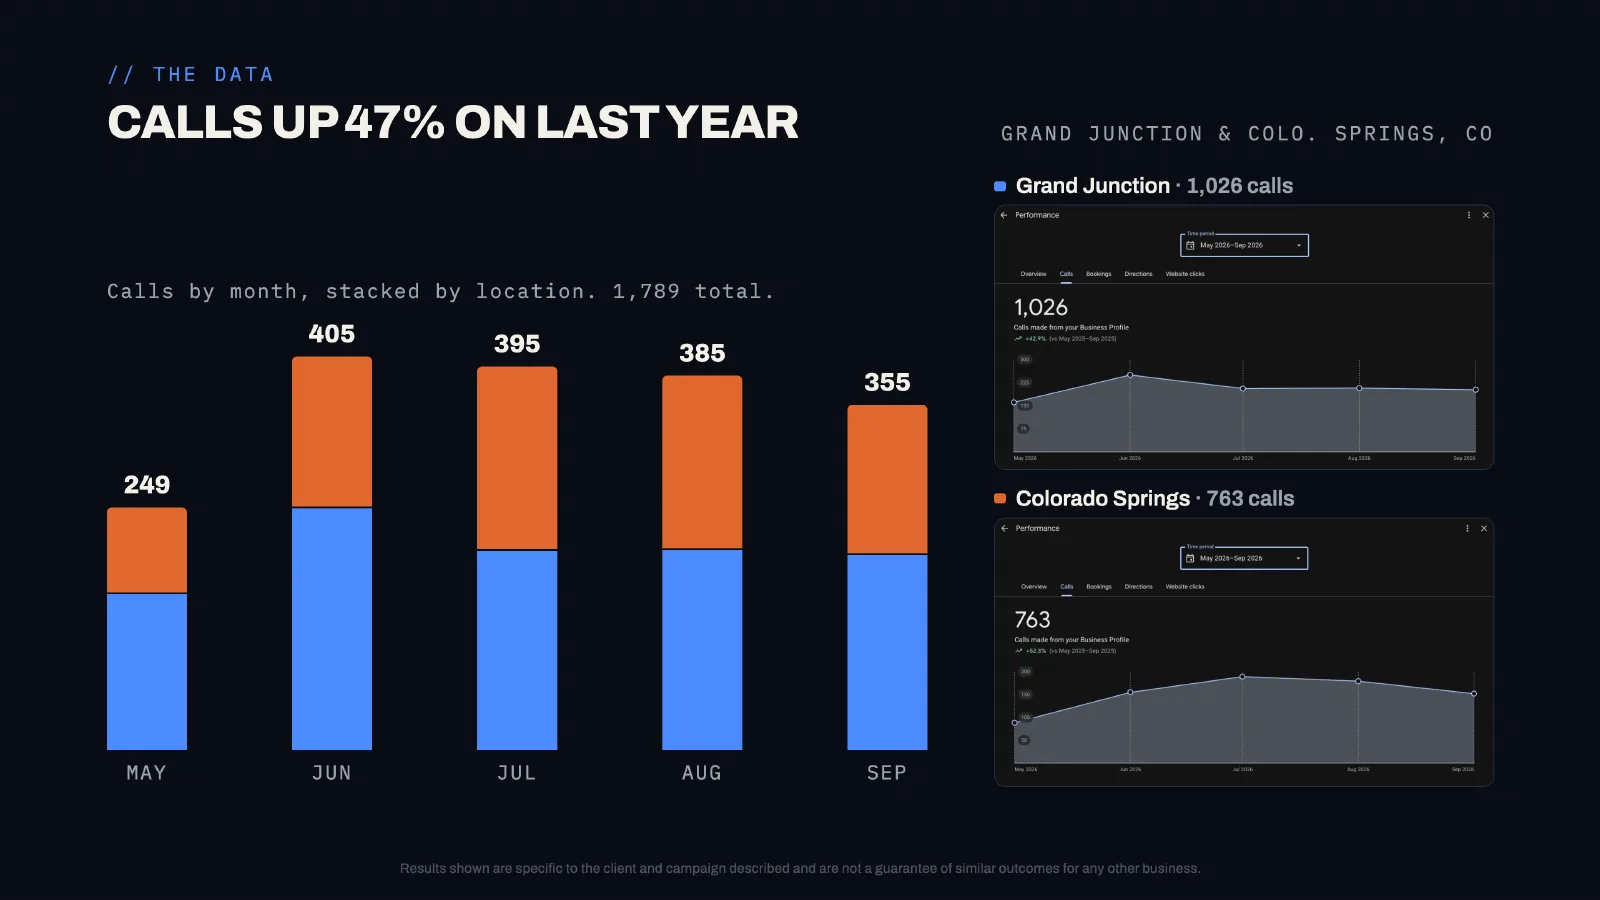
Pest demand is seasonal, and a flat monthly budget wastes money in slow months and misses calls in busy ones. Our clients' reports show it clearly: King Pest Solutions went from 249 calls from Google in May 2026 to 405 at its June peak, and Surge Pest Control from 62 in May to 101 in July.
| Period | Budget approach |
|---|---|
| Late winter | Invest in SEO, pages, profiles and photos. Build termite and spring content. Moderate ad spend. |
| Spring | Raise ad budgets as termite swarms and ants start. Launch past customer campaigns. |
| Summer | Peak ad budgets, matched to how many calls your team can handle. Push recurring plans. |
| Fall | Shift to rodent and overwintering pest campaigns. Win-back campaigns. |
| Early winter | Lower ad spend. Commercial outreach, website projects, planning new locations. |
Shift money to the pest that's peaking in your region rather than spreading it evenly. Your own call history by month and pest is the best guide.
Budgets by stage of business
Startups usually spend above the 6.6% average, established single-market companies near it, and mature multi-location companies at or below it:
| Stage | Priorities | Budget notes |
|---|---|---|
| Startup (first 1–2 years) | Google profile, simple website, reviews, call tracking, LSA, door-to-door if possible | Often above the 6.6% average, because you're buying the recurring book itself |
| Established, one market | Pest and town pages, links, Search ads by pest, retention | Near the benchmark, adjusted by cost per booked job |
| Expanding to new markets | New real offices, new profiles, ads while profiles build | Above benchmark during expansion, planned per location |
| Mature, multi-location | Defend rankings, retention, commercial, efficiency | Often at or below benchmark, with strong organic share |
Surge Pest Control is an example of the startup stage done well. Owner Forrest Jensen started from zero at the end of 2023, did "right around 500-ish K" in year one, and says the business is hitting about $2M in 2026. Door-to-door sales are the core of the business, and we run SEO and the Google profiles. Read the Surge case study.
How to budget for a new location
Opening a new office is the growth move we recommend most often, and it needs its own marketing budget:
- Pre-launch: a location page, Google profile setup and verification, and listings on Bing, Apple and directories.
- First months: higher ad spend, because the new profile won't rank well yet. Local Services Ads and Search ads cover the gap.
- Reviews: start immediately with every customer serviced from the new office.
- Local links and sponsorships in the new town.
- Track it separately, with its own numbers and CRM source, so you can see when it pays for itself.
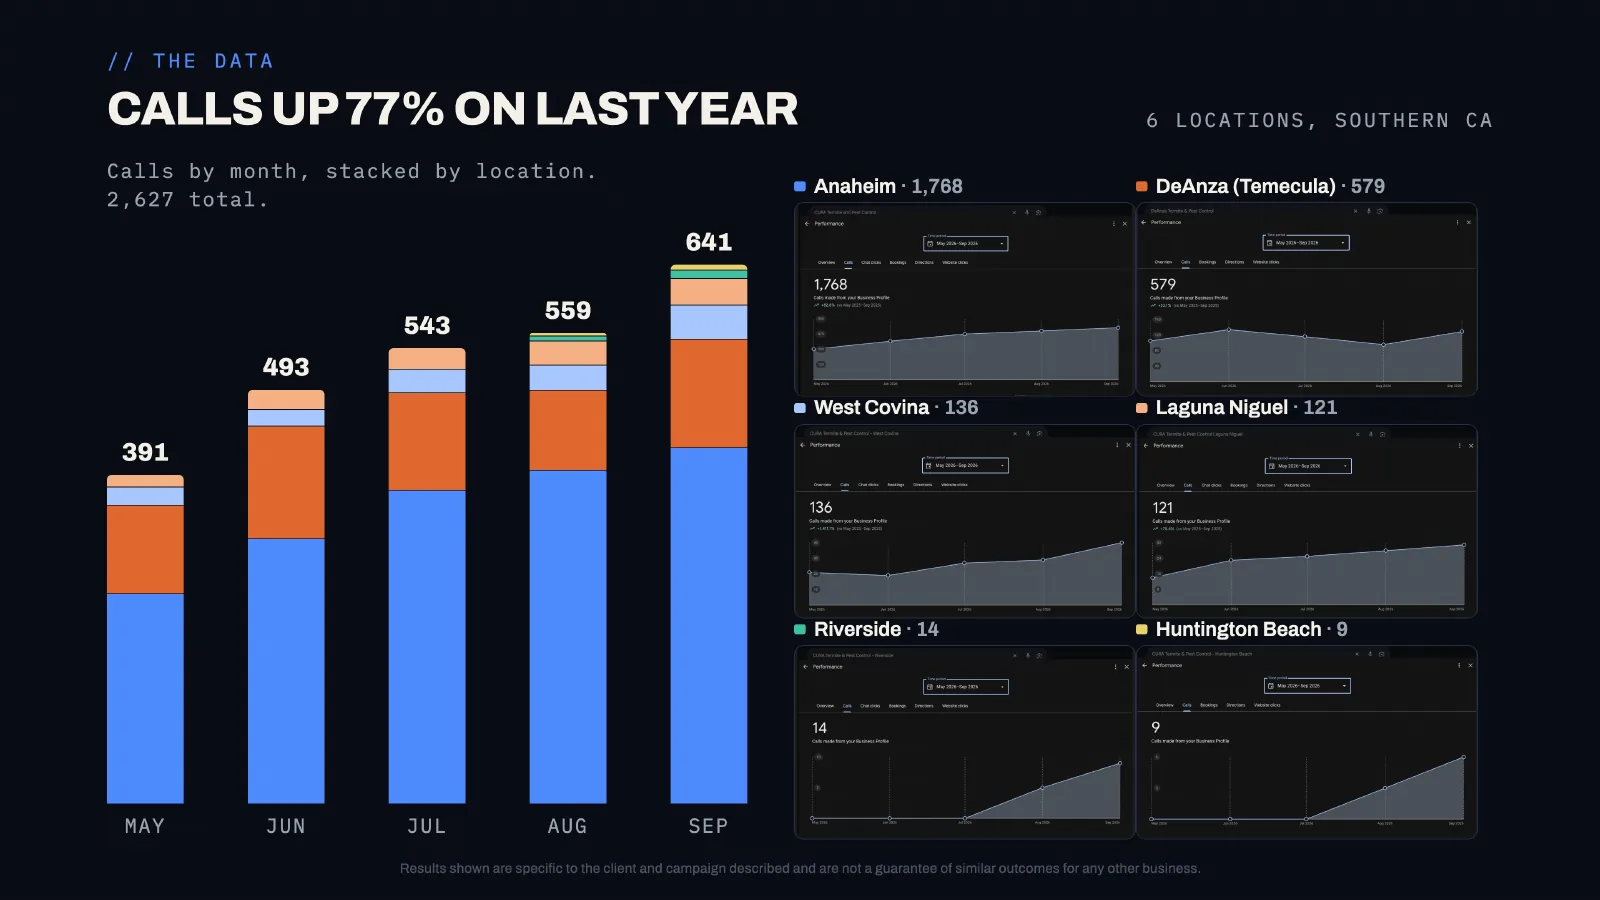
Set expectations from real data. State Termite's new Hartville, Ohio profile had 22 calls in its first three months. Surge's Leander office had 140 in five months. Cura's newest Riverside and Huntington Beach profiles had 14 and 9 in their first months. Larger, more competitive markets take longer, so plan the ad budget to carry the location until the profile builds. See our Google Maps guide for the setup.
Budgeting by service line
Not every service deserves the same share. Weigh each by how much it's worth to you and how people search for it:
| Service | Budget considerations |
|---|---|
| General pest plans | The core of recurring revenue. Steady year-round spend on profiles, reviews and door-to-door, with seasonal ad increases. |
| Termite | High value per job and often competitive in ads. Inspections lead to treatments and real estate work. Budget for a strong termite page and spring campaigns. |
| Rodent and exclusion | Urgent searches, strongest in fall and winter. Search ads and pages for "mice in attic" style searches. |
| Mosquito and tick | Seasonal programs sold ahead of the season. Past customer campaigns and neighborhood marketing tend to be efficient. |
| Bed bugs | Urgent and often high value. A detailed page and Search ads, with discreet messaging. |
| Wildlife (where licensed) | Separate pages and ads, with clear explanations of local rules. |
| Commercial | Longer sales cycles and larger accounts. Budget for industry pages and direct outreach rather than broad ads. |
Look at your revenue and margin by service, then at cost per booked job by service. Put more behind the services that are both profitable and growing.
Budgeting across multiple locations
With several offices, a single company-wide budget hides what's working. Budget and track by location:
- Give each location its own targets for calls, booked jobs and new plans.
- Split ad budgets by location, since lead costs and competition differ between markets.
- Spend more on newer locations while their profiles build, and less where a mature profile already ranks at the top.
- Keep shared costs separate: brand, website platform, software and agency fees that cover every office.
- Review by location monthly, using reports that break calls out by office.
Cura is a useful picture of this. Its Anaheim office produced 1,768 calls from May to September 2026, while its newest Riverside and Huntington Beach profiles produced 14 and 9 as they started. The same budget per location would make no sense. Mature offices need defending. New ones need building.
How long until marketing pays back?
Different channels pay back on different timelines, and a budget should account for that:
| Channel | Typical timeline |
|---|---|
| Local Services Ads and Search ads | Calls within days of launch. Payback depends on cost per booked job and plan conversion. |
| Google profile improvements | Often weeks for fixes like categories and services. Rankings build over months. |
| Reviews | Close rate improves quickly. Ranking effects build over months. |
| SEO pages and links | Usually several months to rank, then compounding for years. |
| New location | Months to build rankings and calls, depending on market size. |
| Door-to-door | Sales from the first week, with payback depending on retention. |
A healthy budget mixes fast channels that pay back this season with compounding channels that make next year cheaper. Companies that only fund the fast channels keep paying the same price for every call. Companies that only fund the slow ones can run short of work while they wait.
Questions to ask before increasing your budget
Only raise the budget once you know cost per booked job by channel and you're answering nearly every call:
- Do we know our cost per booked job by channel?
- Are we answering nearly every call during business hours?
- Do we have the technicians to handle more work this season?
- What share of first-time customers become plan customers?
- Which channel has the lowest cost per new plan, and can it take more money?
- Is there a market where we're losing calls because we're too far away?
- Will the extra spend build something we own, like rankings or reviews, or stop the day we stop paying?
If the answers to the first three are "no," fix those first. More leads won't help if they can't be answered or served.
Budgeting for commercial pest control
Commercial accounts behave differently from residential customers: fewer, larger accounts, longer decisions and more relationship selling. A commercial budget usually leans toward:
- Industry pages for restaurants, food processing, healthcare, property management and warehouses.
- Staff time for direct outreach and follow-up.
- Separate commercial Search ad campaigns with their own budgets and landing pages.
- Association memberships and local business events.
- Clear service documentation and reports, which help win renewals.
Track commercial separately, since one account can be worth many residential customers and the cost per account will look very different.
The numbers to track
Track five numbers by channel and location: cost per lead, booking rate, cost per booked job, cost per new plan customer and plan cancellations:
| Metric | Formula | What it tells you |
|---|---|---|
| Cost per lead | Spend ÷ leads | What each inquiry costs, by channel |
| Lead-to-booked rate | Booked jobs ÷ leads | Whether your phones and follow-up convert |
| Cost per booked job | Spend ÷ booked jobs | The number to budget against |
| Plan conversion rate | New plans ÷ first-time jobs | How well you turn one-time callers into recurring revenue |
| Cost per new plan customer | Spend ÷ new plans | Compare with lifetime value |
| Cancellation rate | Plans cancelled ÷ active plans, per year | How long customers stay |
| Marketing % of revenue | Total marketing spend ÷ revenue | How you compare with the benchmark |
| Calls by location | From call tracking and Google profiles | Which markets are growing |
If you only track one, track cost per booked job by channel. It tells you where the next dollar should go.
What our clients' call volumes look like
Budgets are about calls, so here's what the call side looks like for our pest control clients from May to September 2026, from their reports:
| Client | Calls from Google | Change |
|---|---|---|
| Cura Termite & Pest Control (6 locations) | 2,627 | +77% YoY |
| King Pest Solutions (2 locations) | 1,789 | +47% YoY |
| Scout Pest Control (2 locations) | 1,438 | Huntsville +1,119% |
| MMPC Pest Solutions | 744 | About 140 a month |
| Surge Pest Control (2 locations) | 415 | Leander office new |
| Bad Termite | 159 | Up on last year |
Most of these calls come from Google profiles, which cost time and expertise more than ad spend. That's the strongest argument for putting a solid share of any pest control budget into the profile, reviews and local SEO. See all the details on our pest control case studies page.
Where pest control marketing budgets leak
The biggest leaks are missed calls, unworked leads and spend in towns your routes don't reach:
- Missed calls. Every unanswered call is marketing spend thrown away. Check call tracking for missed and after-hours calls.
- Ads without negative keywords. DIY, jobs and product searches eat pest control ad budgets.
- Undisputed LSA leads. Out-of-area and wrong-service leads you never disputed.
- Broad automated campaigns without tracking. Spending that can't be tied to calls.
- Shared lead marketplaces. Leads sold to several companies, with nothing built for you.
- Flat budgets through the slow season. Ad money spent when demand isn't there.
- Weak plan conversion. Paying to acquire one-time customers who never become recurring.
- Paying for activity, not outcomes. Reports of posts and blog articles with no change in calls. Seth Fenn at Cura paid a previous agency for "a couple years" of blog posts and said, "I don't think anything increased."

Agency, in-house or both?
How you staff marketing affects the budget as much as ad spend. Compare options on the work delivered, not just the cost:
- Doing it yourself costs the least in cash and the most in your time.
- An in-house marketer makes sense once you have several locations and enough work for a full-time role, though one person rarely covers SEO, ads, web and tracking at expert level.
- An agency brings specialists across channels. Separate its fees from your ad spend, and make sure you own your accounts.
- A hybrid keeps reviews, photos and posts in-house and hands SEO, web and ads to an agency.
For how to compare options fairly, see how to choose a pest control marketing agency.
A 12-month budget planning checklist
- Pull last year's revenue, marketing spend by channel and calls by month.
- Calculate cost per booked job and cost per new plan by channel.
- Set goals for new customers and plans, by location.
- Build the bottom-up budget and compare it with the 6.6% industry average.
- Decide on any new location and add its launch budget.
- Spread ad spend by month to match your seasonal call curve.
- Reserve budget for tracking, website and reviews before ads.
- Set a monthly review: spend, calls, booked jobs and cost per booked job by channel.
- Set a quarterly decision: move money from the weakest channel to the strongest.
- Recheck margins and retention halfway through the year.
Common pest control marketing budget mistakes
The most common mistake is picking a number before knowing what a booked job costs:
- Picking a number without knowing your cost per booked job.
- Judging marketing by one-visit revenue instead of plan lifetime value.
- Spreading a small budget across too many channels to measure any of them.
- Cutting SEO and the Google profile first when money is tight, then paying more for ads later.
- Not counting staff time, software and door-to-door costs, so the percentage looks lower than it is.
- Expanding to a new market without budgeting for the months before the new profile ranks.
- Copying a competitor's budget without knowing their margins or results.
For the full channel plan, see the pest control marketing guide, and for more channel options, 45 pest control marketing ideas.