
Our pest control clients produced about 7,400 calls from Google between May and September 2026. Cura Termite & Pest Control led with 2,627 calls across six Southern California locations, up 77% year over year. King Pest Solutions had 1,789, up 47%. Scout Pest Control had 1,438, with its Huntsville location up 1,119%. MMPC Pest Solutions is #1 for pest control in Long Island City, Modern Pest Control is #1 for three keywords in Staunton, Bad Termite is #1 for "termite inspection" in Granada Hills, State Termite grew North Canton calls 34.9%, and Surge Pest Control produced 415 calls across two Texas offices. Every number on this page comes from our clients' 2026 reports.
This page collects our pest control results in one place: who the clients are, where they operate, what the reports show, and what we think made the difference. We use client names and real numbers because anonymous screenshots aren't worth much. Results are specific to each client, market and campaign. Other companies will see different results, and we've tried to be clear about where a number is small, new or still building.
Pest control marketing results at a glance
Eight pest control clients, about 7,400 calls from Google between May and September 2026, and #1 map rankings in four markets. Here's each one in a line:
| Client | Market | Headline result | Period |
|---|---|---|---|
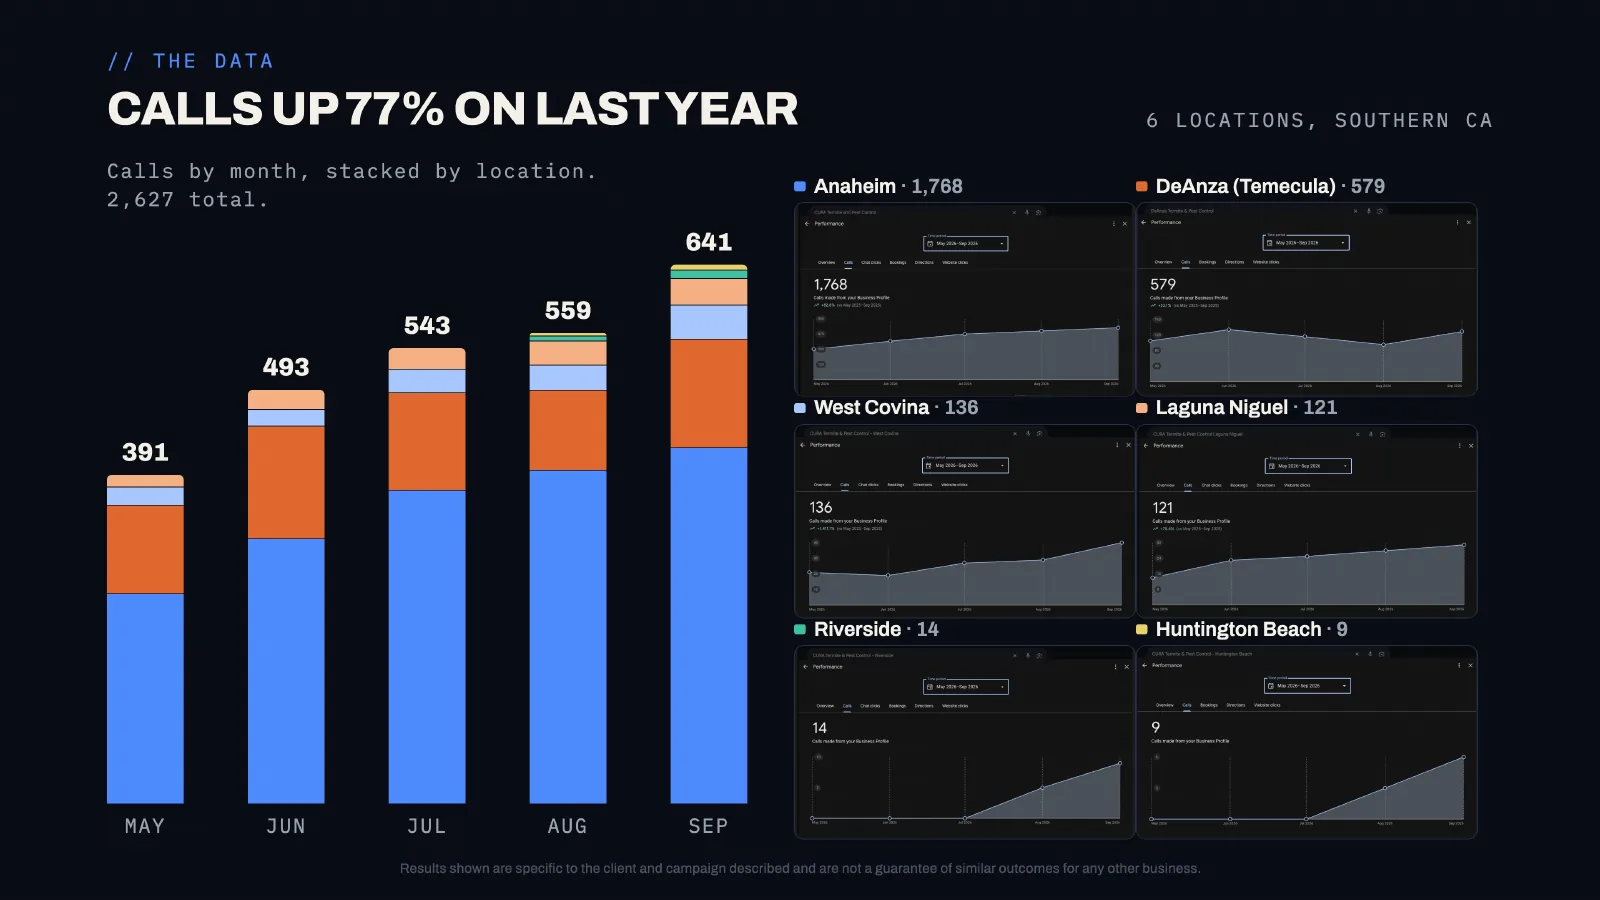
| Cura Termite & Pest Control | Southern California, 6 locations | 2,627 calls from Google, up 77% YoY | May–Sep 2026 |
| King Pest Solutions | Grand Junction & Colorado Springs, CO | 1,789 calls, up 47% YoY. #1 for "pest control" in Grand Junction | May–Sep 2026 |
| Scout Pest Control | Tanner & Huntsville, AL | 1,438 calls. Huntsville up 1,119% YoY | May–Sep 2026 |
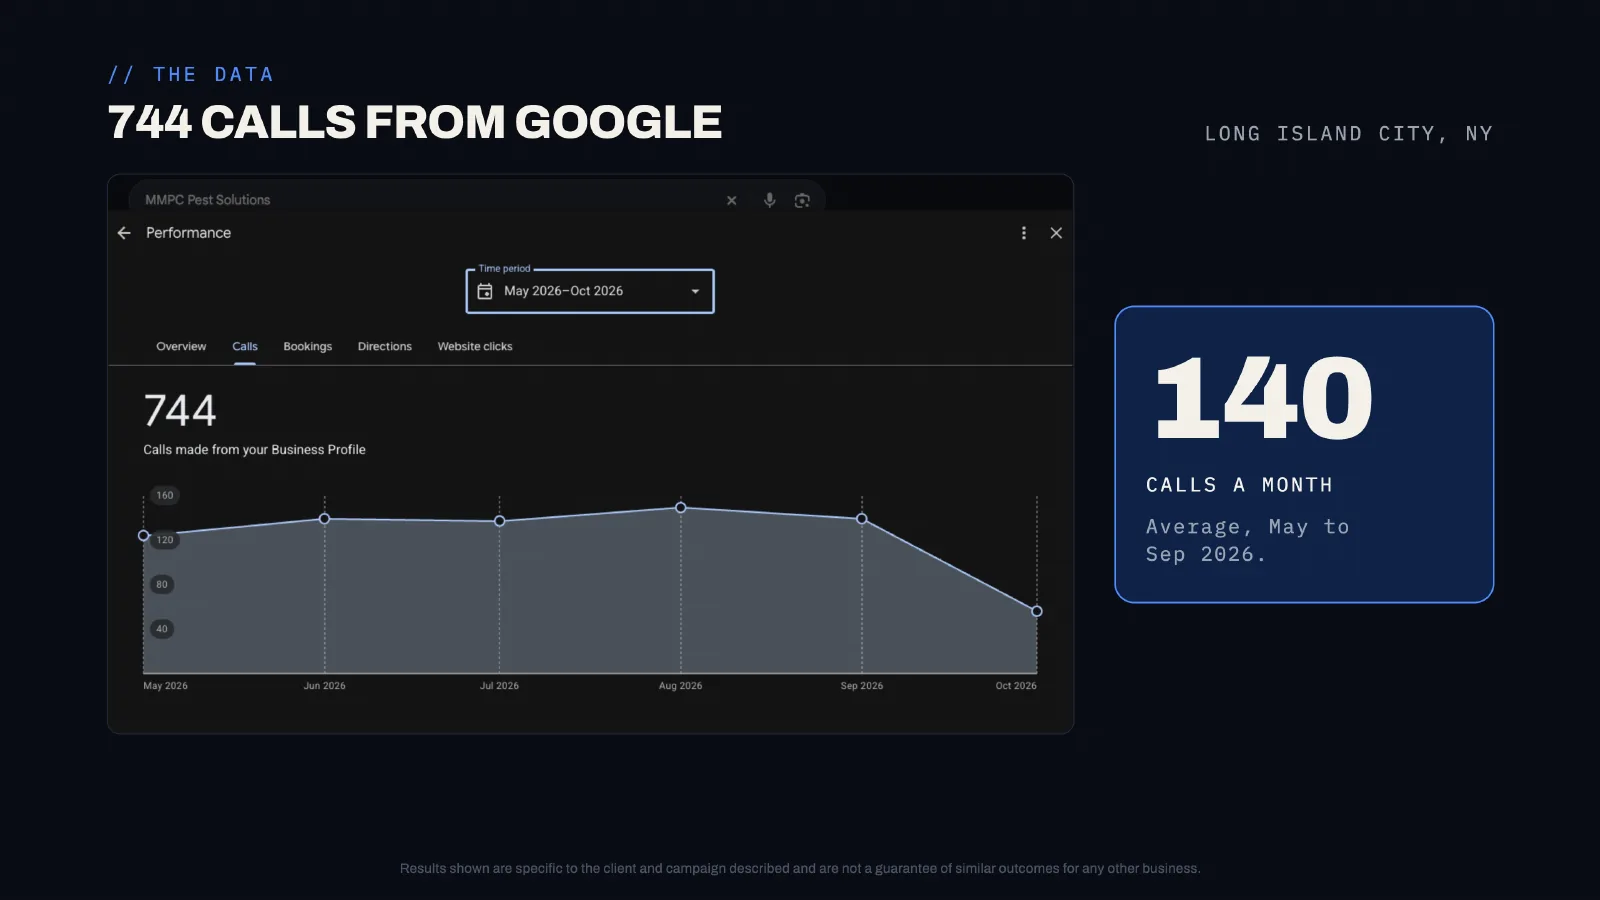
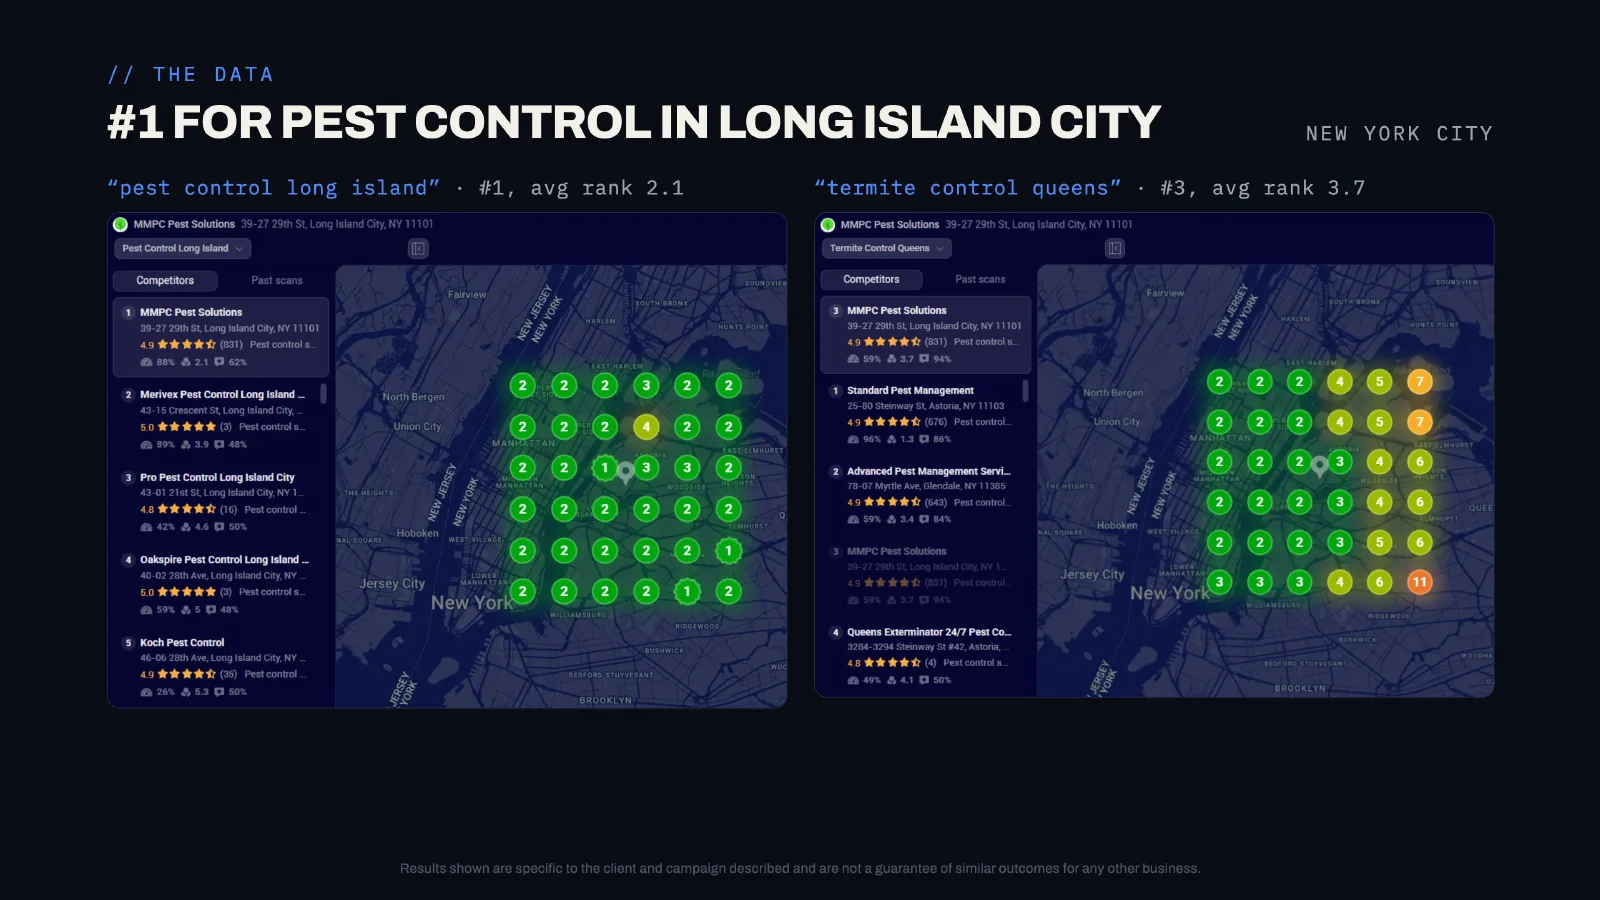
| MMPC Pest Solutions | Long Island City, Queens, NY | 744 calls, about 140 a month. #1 for pest control, 88% of the map in the top 3 | May–Sep 2026 |
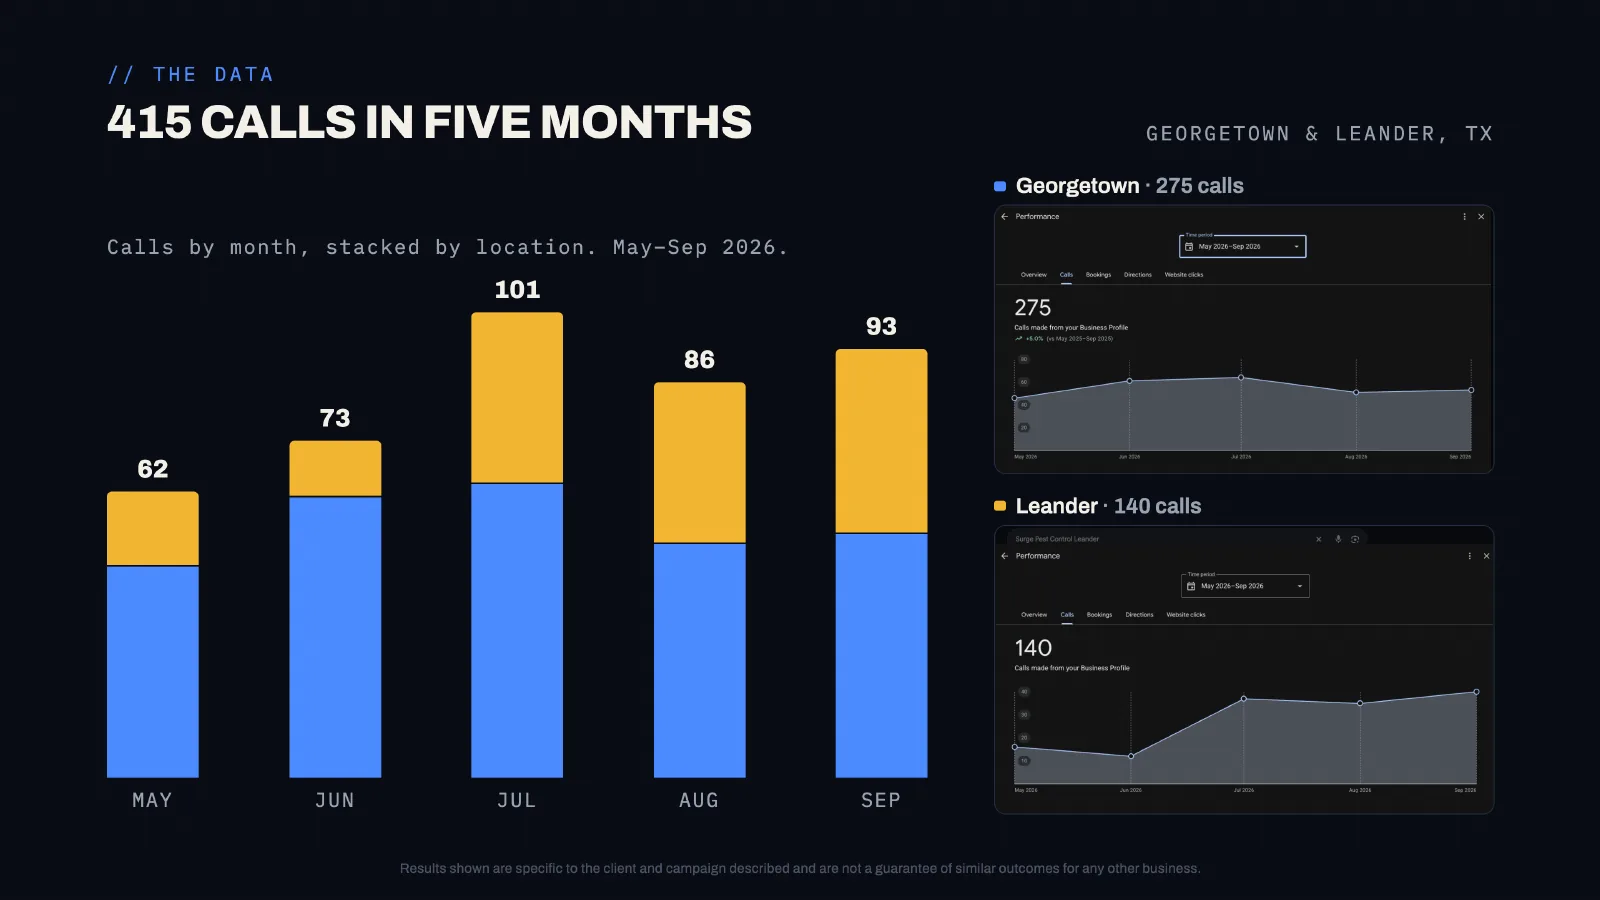
| Surge Pest Control | Georgetown & Leander, TX | 415 calls across two offices | May–Sep 2026 |
| State Termite & Pest Solutions | North Canton & Hartville, OH | 219 calls. North Canton up 34.9% YoY | Jun–Aug 2026 |
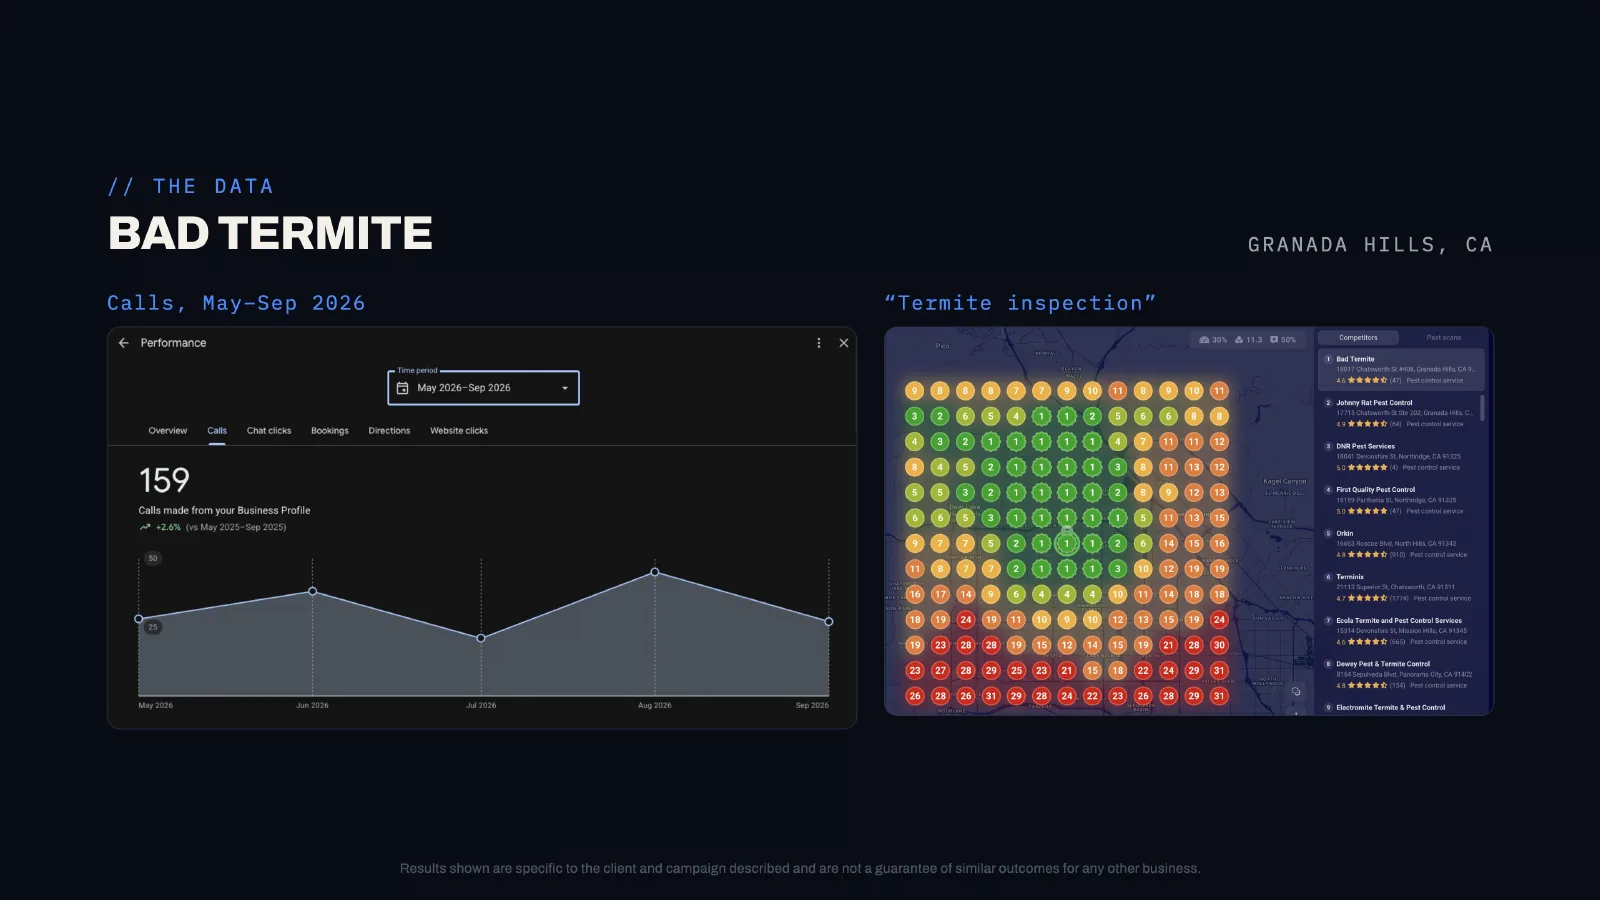
| Bad Termite | Granada Hills, CA | 159 calls, up on last year. #1 for "termite inspection" | May–Sep 2026 |
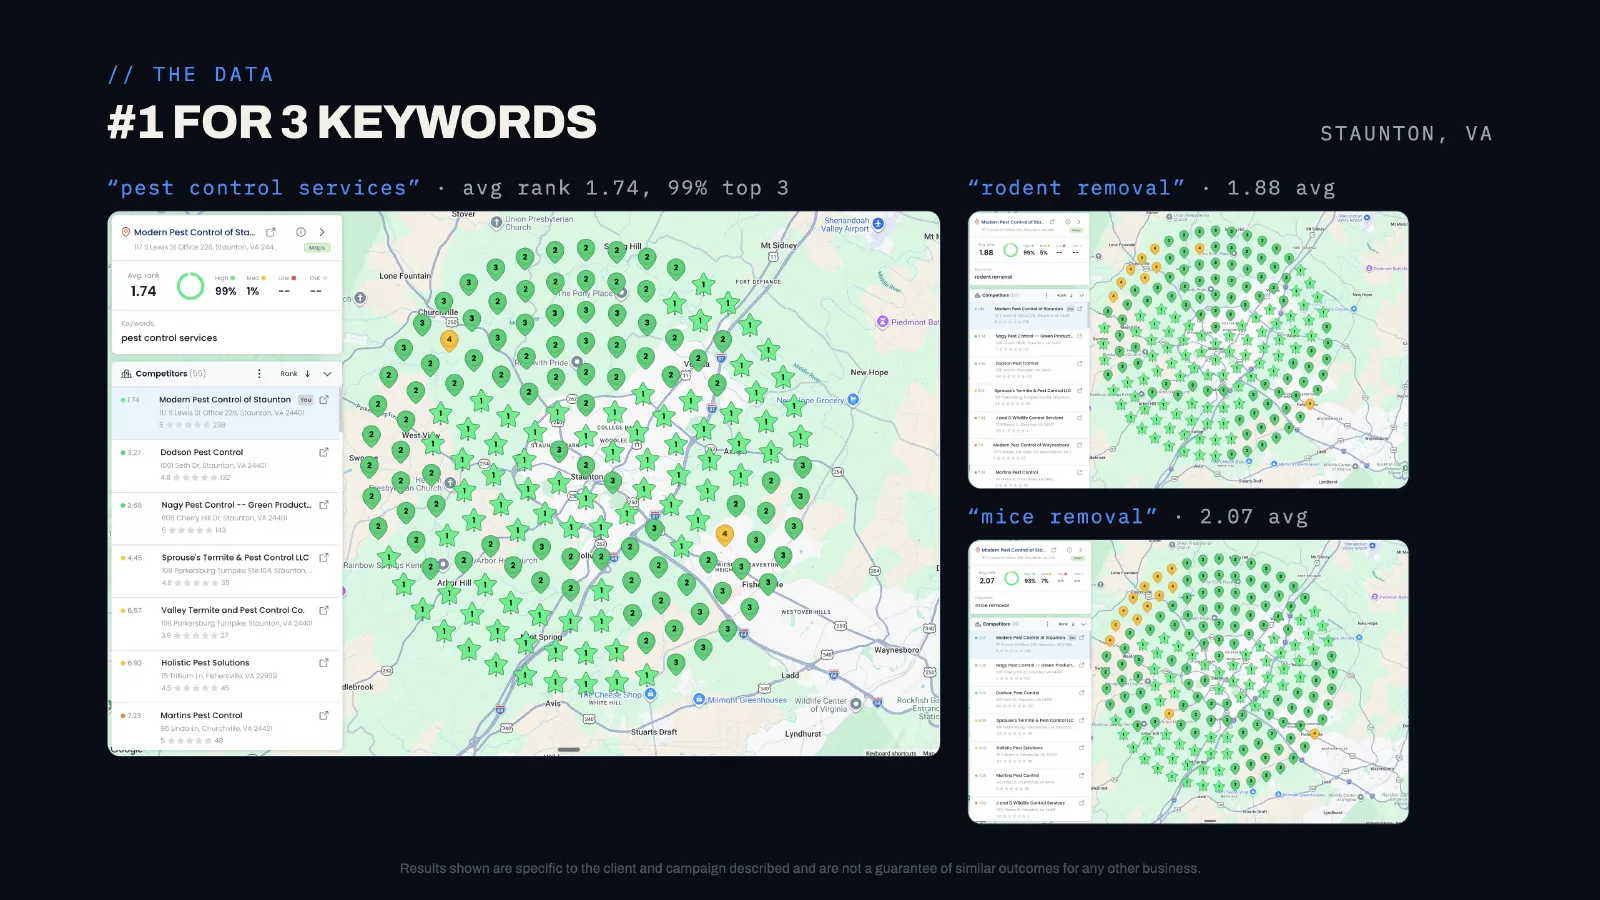
| Modern Pest Control | Staunton, VA | #1 on Google Maps for 3 keywords, 99% of the map in the top 3 for "pest control services" | 2026 |
Calls are counted from Google Business Profile and Google call tracking in each client's reports. "Avg rank" is the average Google Maps position across a grid of points in the client's service area, and "top 3" is the share of grid points where the client ranks in the map pack.
Featured: Surge Pest Control, zero to about $2M
Surge Pest Control started at zero at the end of 2023 and reached about $2M in 2026, according to owner Forrest Jensen. Door-to-door sales are the core of the business. Search marketing was built on top: a Georgetown, Texas profile ranking well for "exterminator" and "pest control," then a second real office in Leander with its own profile.
From May to September 2026, Surge's profiles produced 415 calls: 275 from Georgetown and 140 from Leander. Monthly calls grew from 62 in May to a peak of 101 in July, and stayed in the 86–93 range through August and September. In Georgetown, Surge averages 2.89 for "exterminator," with 72% of the map in the top 3, and 3.48 for "pest control," with 61%. The newer Leander office averages 3.67 for "pest control," with 67% in the top 3, and 4.34 for "pest control near me," with 59%.
On adding a third office, Forrest told Bodhi, "I'm sure we'll get a third one." The full story, including the video, is in the Surge Pest Control case study.
Cura Termite & Pest Control: 2,627 calls, up 77%
Market: Anaheim, Temecula, West Covina, Laguna Niguel, Torrance, Riverside and Huntington Beach, California.
Cura is our largest pest control client by call volume. From May to September 2026, its six Google profiles produced 2,627 calls, up 77% on the same period the year before. Anaheim, the original office, produced 1,768. Temecula, which operates as DeAnza Termite & Pest Control, produced 579. West Covina produced 136, Laguna Niguel 121, and two newer locations, Riverside and Huntington Beach, added 14 and 9 as they started building. Monthly calls rose from 391 in May to 641 at the peak.
| Location | Calls, May–Sep 2026 | Average map rank |
|---|---|---|
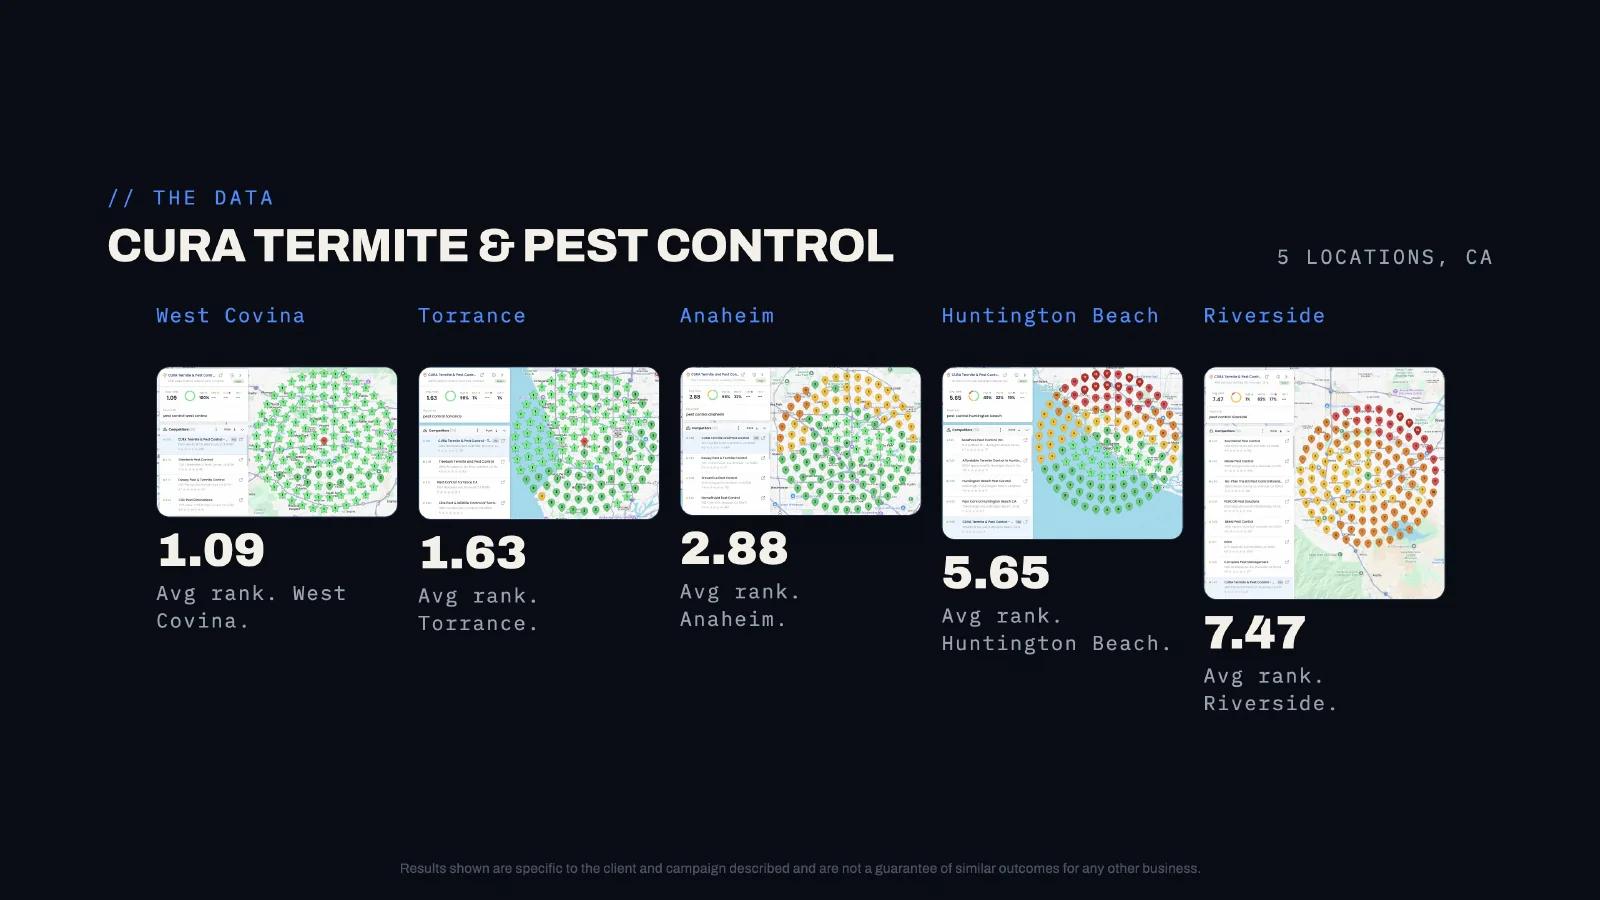
| Anaheim | 1,768 | 2.88 |
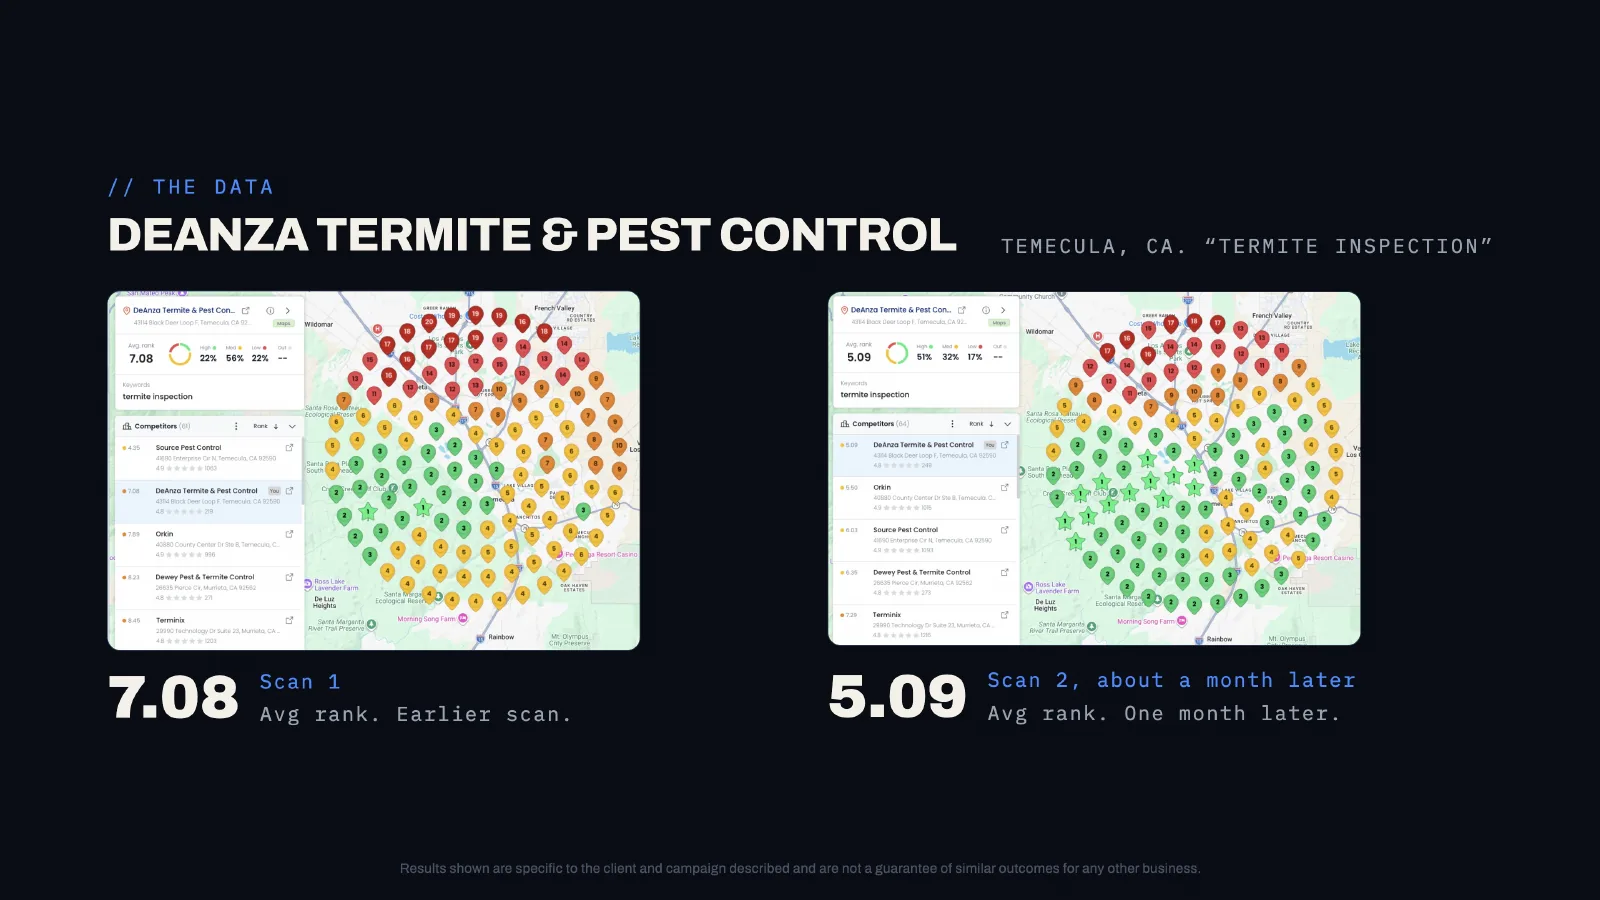
| Temecula (DeAnza) | 579 | Improved from 7.08 to 5.09 for "termite inspection" in about a month |
| West Covina | 136 | 1.09 |
| Laguna Niguel | 121 | Not tracked in this report |
| Torrance | Not in this call report | 1.63 |
| Huntington Beach | 9 (new) | 5.65 |
| Riverside | 14 (new) | 7.47 |
Across the five tracked locations, Cura's average map rank is 3.74. The pattern is the useful part. The established offices, like West Covina at 1.09 and Torrance at 1.63, sit at the top of the map. Newer ones like Riverside at 7.47 are still climbing, and their call counts are small. That's what a multi-location map strategy looks like in real data: each real office builds its own rankings and reviews over time.
Owner Seth Fenn names "the SEO, our door knocking, and then obviously Yelp" as Cura's top channels. He's also candid about what didn't work before: a previous agency's "couple years" of blog posts, after which, he says, "I don't think our domain authority, I don't think anything increased."

King Pest Solutions: 1,789 calls, up 47%
Market: Grand Junction and Colorado Springs, Colorado.
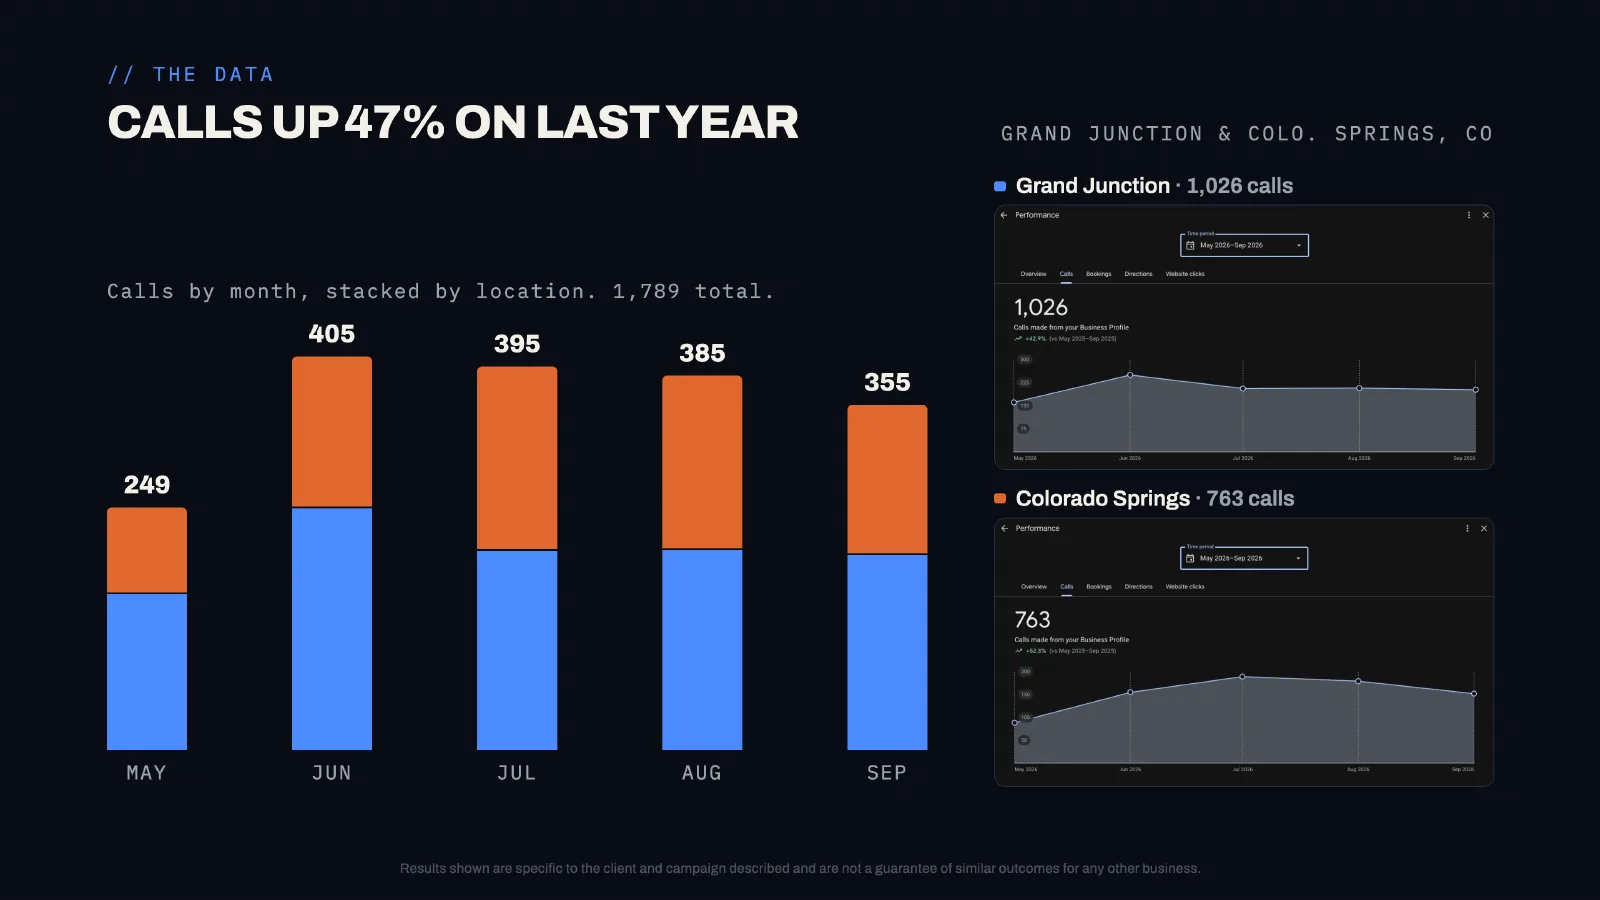
King Pest Solutions' two Google profiles produced 1,789 calls from May to September 2026, up 47% on the year before. Grand Junction produced 1,026 and Colorado Springs 763. Monthly calls ran from 249 in May to 405 at the peak, holding near 400 through the summer before easing to 355 in September.
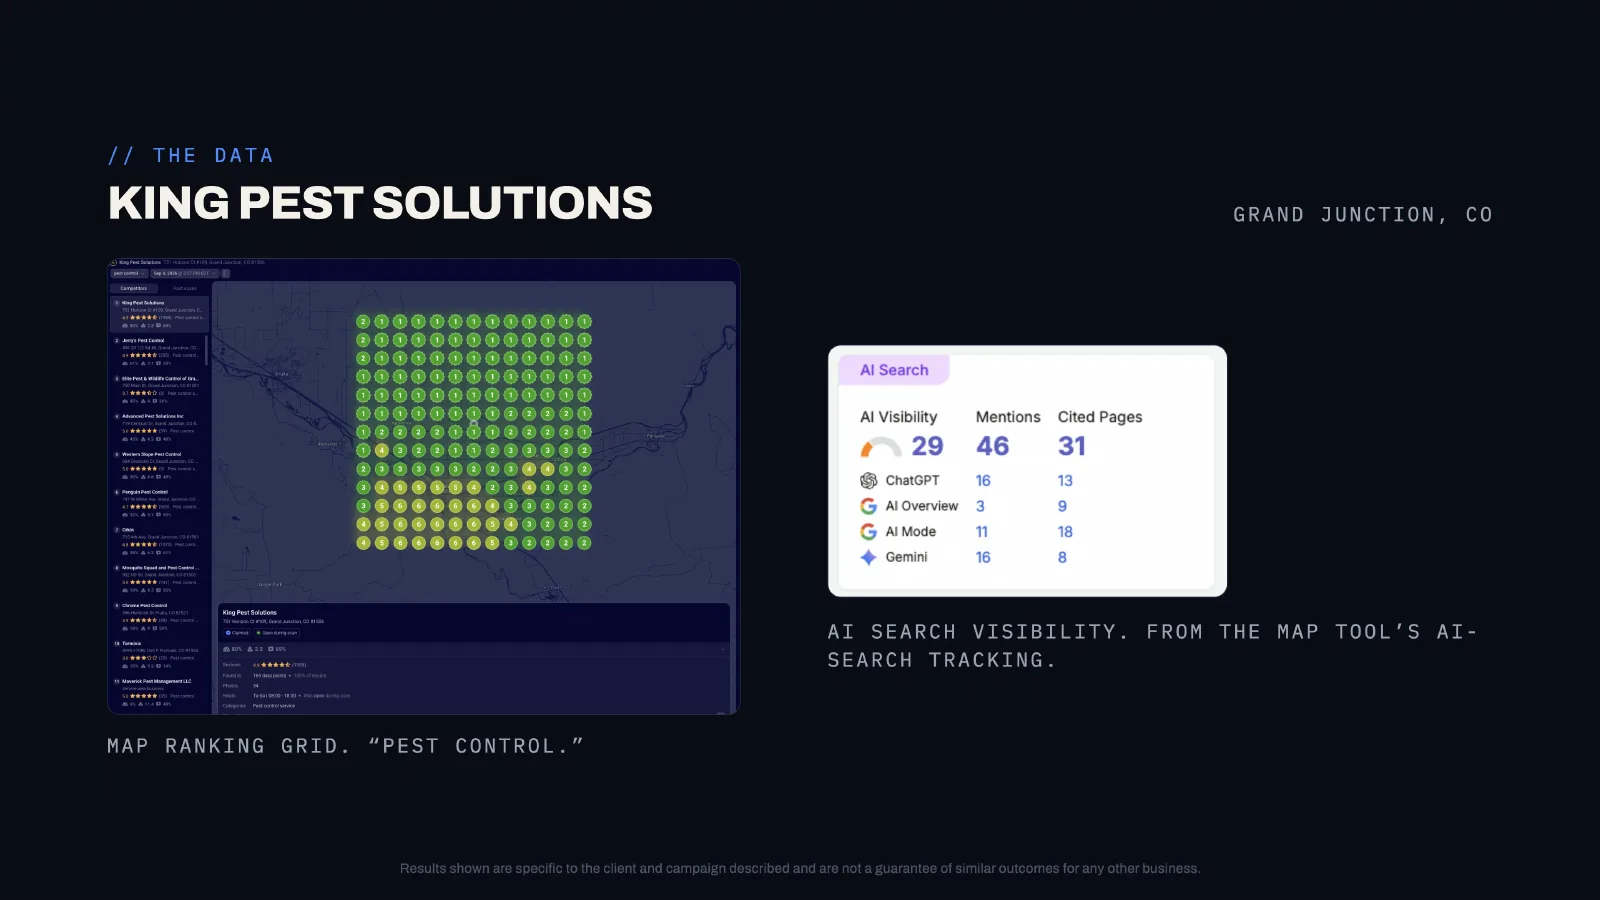
In Grand Junction, King is #1 on Google Maps for "pest control," ahead of the 10 competitors tracked in its report. Its reporting also includes AI search visibility tracking from its map tool, which is part of how we watch whether a company is being named in AI answers. See our AI search guide for how that tracking works and its limits.
King's results show what two strong locations in different markets can produce. Grand Junction is a smaller market where King dominates the map. Colorado Springs is larger and more competitive, and still produced 763 calls.
Scout Pest Control: 1,438 calls, Huntsville up 1,119%
Market: Tanner and Huntsville, Alabama.
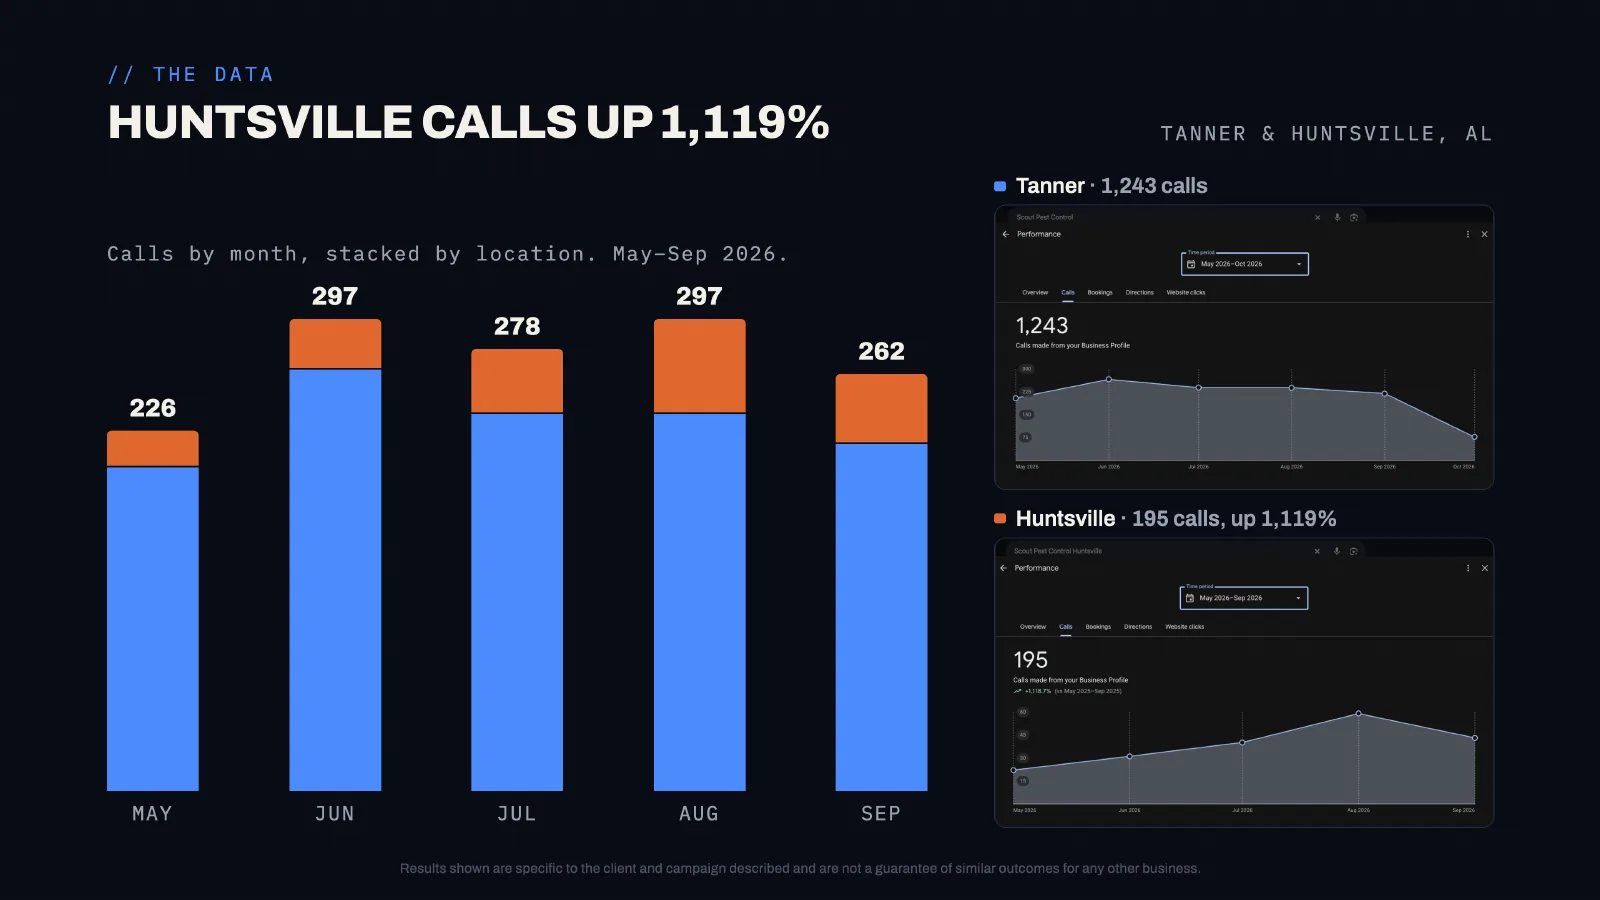
Scout Pest Control's two Google profiles produced 1,438 calls from May to September 2026. Tanner, the established office, produced 1,243. Huntsville produced 195, up 1,119% on the year before. Monthly calls ranged from 226 in May to 297 at the peak.
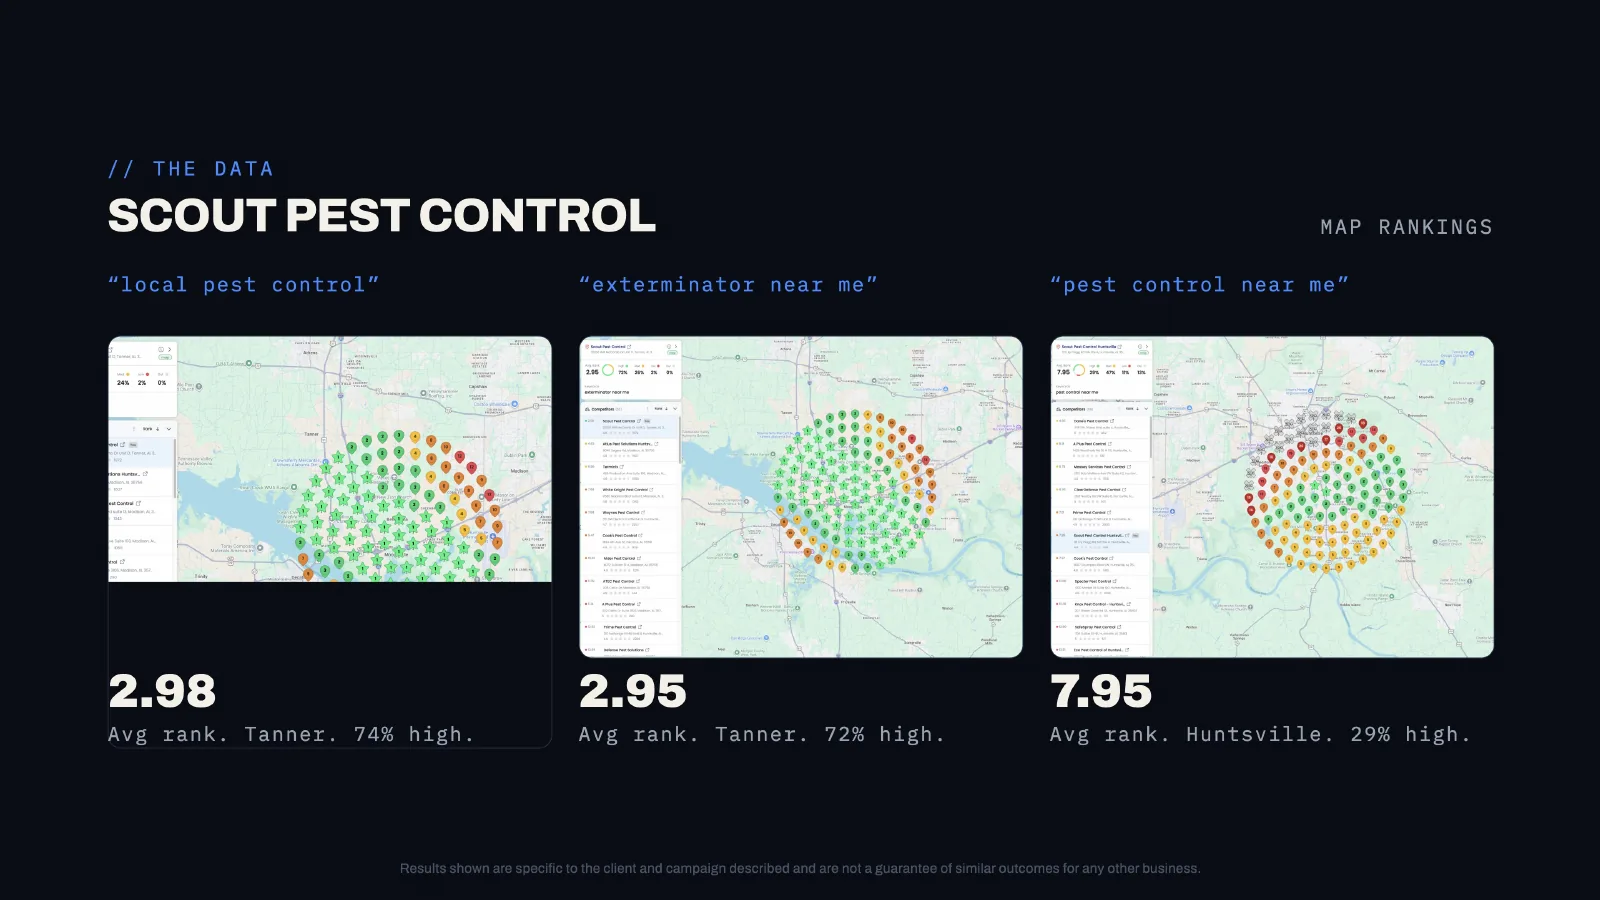
| Keyword | Location | Average rank | Grid ranking high |
|---|---|---|---|
| "local pest control" | Tanner | 2.98 | 74% |
| "exterminator near me" | Tanner | 2.95 | 72% |
| "pest control near me" | Huntsville | 7.95 | 29% |
Scout is a good example of being honest about a market that's still building. Huntsville's growth rate is dramatic because it started small, and its average rank of 7.95 for "pest control near me" shows there's real work left in a larger, more competitive city. Tanner, by contrast, ranks near the top across most of its grid.
MMPC Pest Solutions: #1 in Long Island City
Market: New York City, based in Long Island City, Queens.
MMPC Pest Solutions' Google profile produced 744 calls from May to September 2026, about 140 a month. In a dense, crowded New York City market, MMPC is #1 for "pest control long island," with an average rank of 2.1 and 88% of the map in the top 3. It also ranks #3 for "termite control queens," with an average rank of 3.7.
New York is a hard place to win the map: dense, full of competitors, and with a small radius where any one profile can rank. MMPC's results come from a single strong profile, not a network of locations, which shows how much a complete profile, steady reviews and good local pages can do even in a big city.
State Termite & Pest Solutions: North Canton up 34.9%
Market: North Canton and Hartville, Ohio.
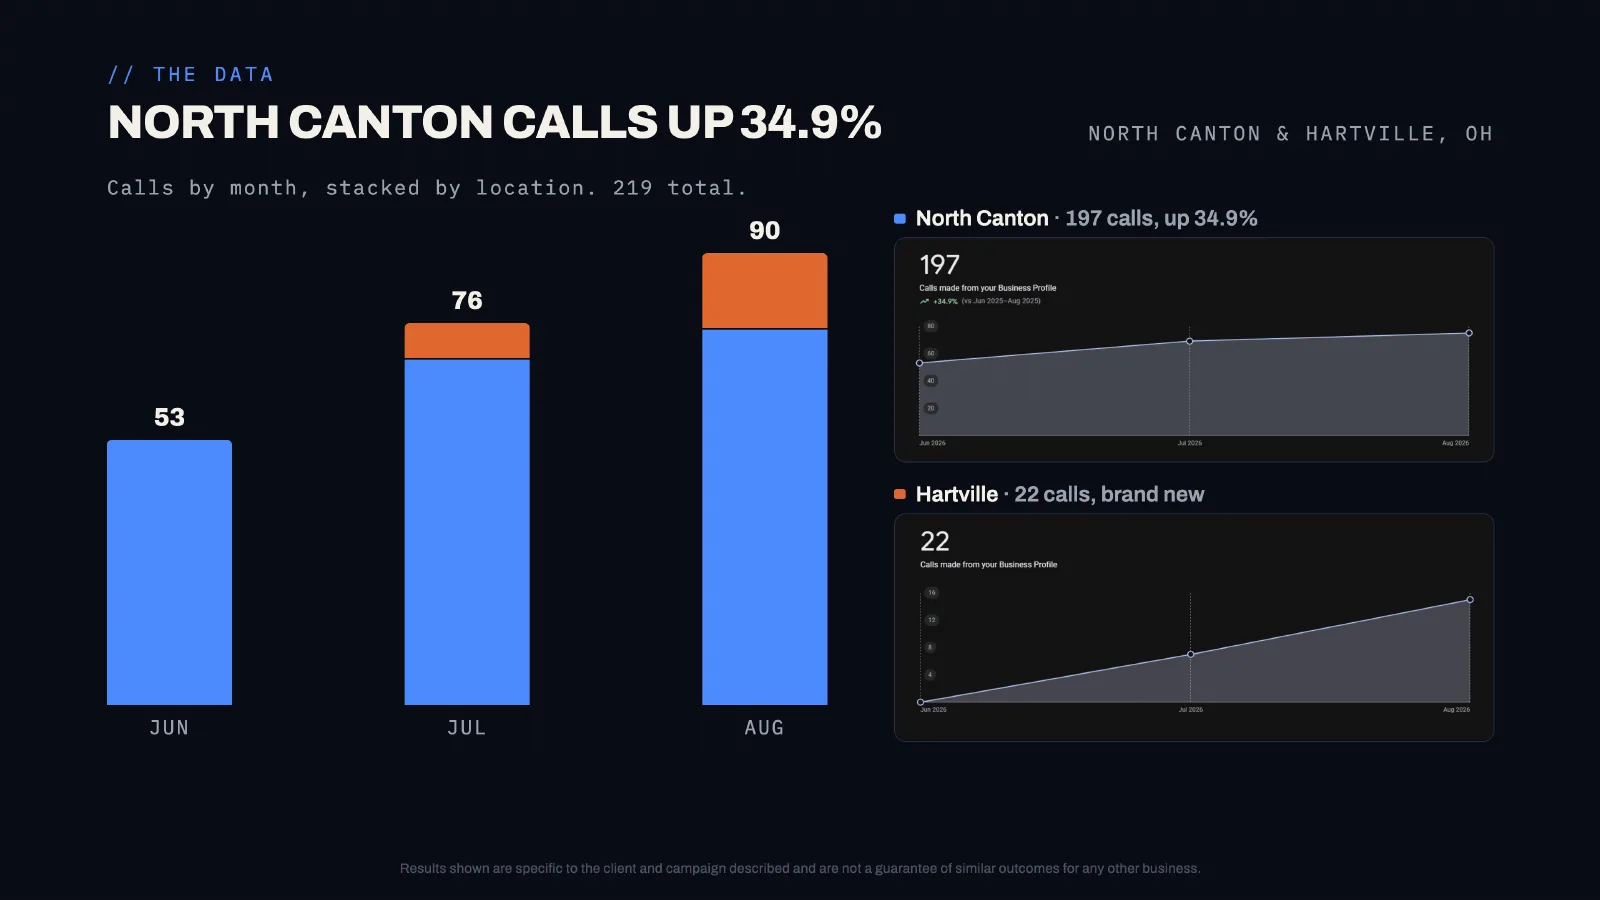
State Termite's two Google profiles produced 219 calls from June to August 2026. North Canton produced 197, up 34.9% on the same months in 2025. Hartville, a brand-new profile, produced 22 in its first three months. Monthly calls grew from 53 in June to 90 in August.
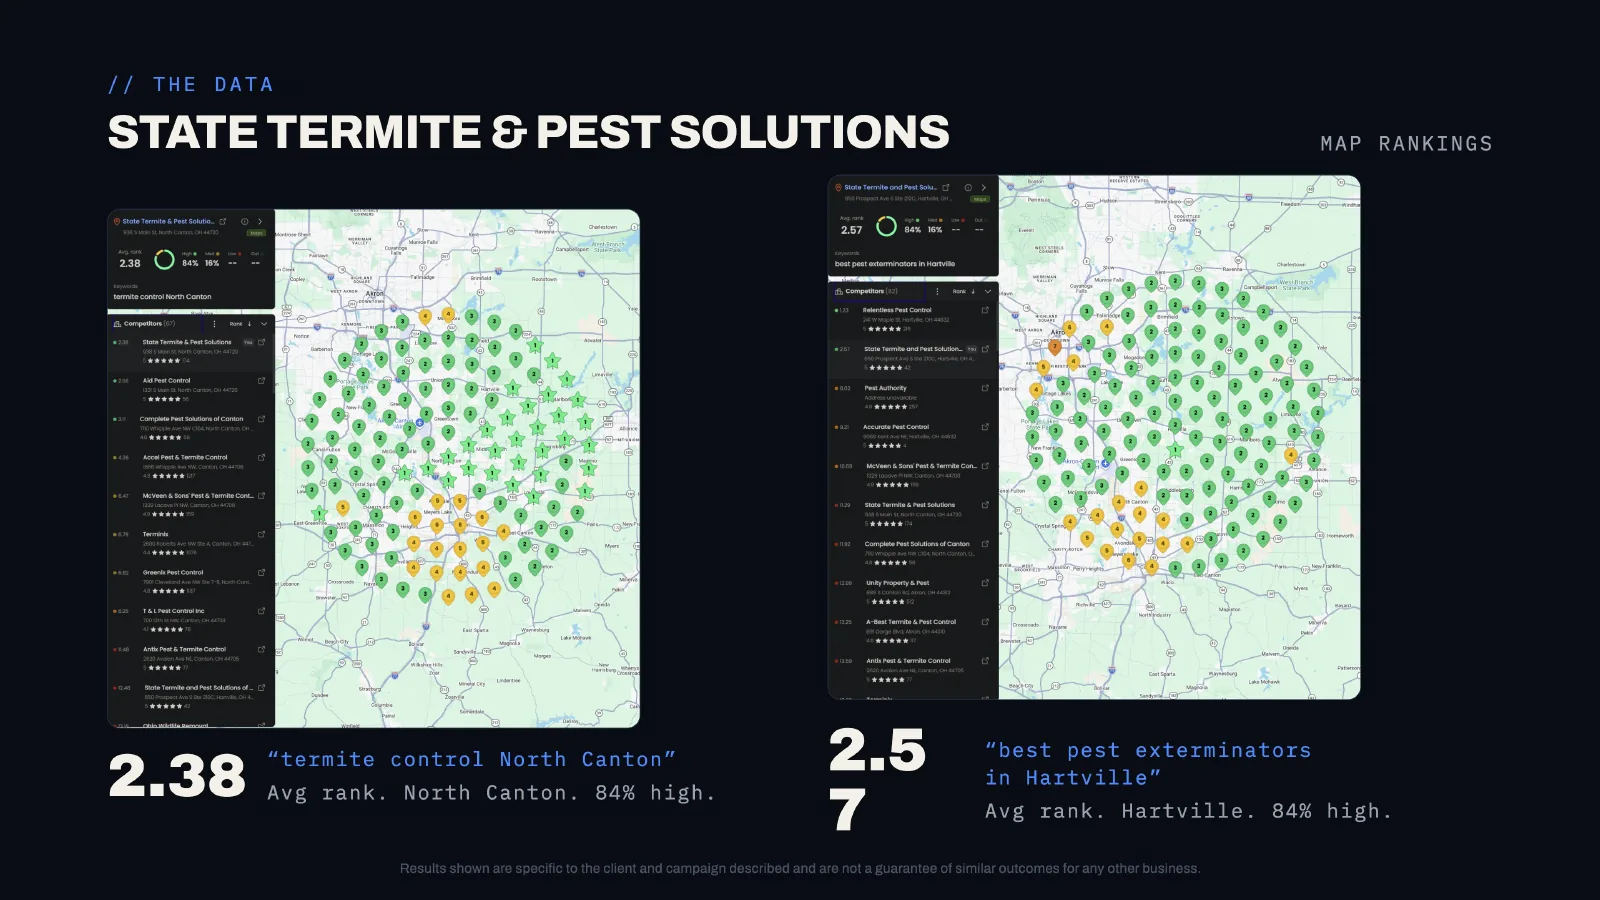
North Canton averages 2.38 for "termite control North Canton," with 84% of the grid ranking high. The new Hartville profile already averages 2.57 for "best pest exterminators in Hartville," also with 84% ranking high. Hartville's call count is small, which is normal for a new profile while it builds reviews and history. Its strong early rankings are the leading sign.
Bad Termite: #1 for "termite inspection"
Market: Granada Hills, California.
Bad Termite is a termite specialist, and its marketing is built around one high-value search: "termite inspection." Its Google profile produced 159 calls from May to September 2026, up on the year before, and it ranks #1 for "termite inspection" across the heart of Granada Hills.
Bad Termite is the smallest call count on this page, and that's the point of including it. A specialist doesn't need thousands of calls. Termite inspections often lead to larger treatment jobs, and real estate inspections bring repeat work from agents. Owning the one search that matters in your core market can be worth more than ranking loosely for everything.
Modern Pest Control: #1 for three keywords
Market: Staunton, Virginia.
Modern Pest Control ranks #1 on Google Maps for three keywords in Staunton. For "pest control services," its average rank is 1.74, with 99% of the map in the top 3. It also averages 1.88 for "rodent removal" and 2.07 for "mice removal."
Modern's results show the value of pest-specific services and pages. Ranking for "rodent removal" and "mice removal," not just "pest control," means Modern shows up when homeowners search for the exact problem they have. Its report covers rankings rather than call counts, so we haven't listed calls here.
Want this built for your pest control company? Book a free growth call and we'll review your Google profiles, site and rankings.
Book a Growth CallWhat do these pest control results have in common?
The companies on this page are different sizes, in different markets, with different service mixes. The work behind their results is remarkably similar:
- Complete Google profiles for every real location. The right categories, every service, real service areas, real photos. See our Google reviews and Business Profile guide.
- Steady reviews from every customer. Asked the same way after every service, with no incentives, no filters and no scripts. Our best-performing clients get 25 new reviews/month.
- Real offices for new markets. Cura, King, Scout, Surge and State Termite grew by adding real, staffed locations with their own profiles, not virtual offices.
- Pest-specific targeting. Termite inspection for Bad Termite and DeAnza, rodent and mice removal for Modern, exterminator and pest control for Surge.
- Grid tracking across the service area. Every client's rankings are measured across a map grid, not from the front door of the office.
- Reporting in calls. Each report starts with calls from Google, by location and month.
None of these companies got there with a trick. They got there by doing the fundamentals every month, in every location. The full playbook is in our Google Maps guide and our pest control SEO guide.
What new locations look like vs. established ones
One of the most useful things these reports show is what to expect from a new location. Almost every multi-location client has at least one office that's still building:
| Client | Established location | Newer location |
|---|---|---|
| Cura | Anaheim: 1,768 calls, avg rank 2.88 | Riverside: 14 calls, avg rank 7.47 |
| Scout | Tanner: 1,243 calls, avg rank 2.98 | Huntsville: 195 calls (up 1,119%), avg rank 7.95 |
| Surge | Georgetown: 275 calls, avg rank 2.89 | Leander: 140 calls, avg rank 3.67 |
| State Termite | North Canton: 197 calls (up 34.9%), avg rank 2.38 | Hartville: 22 calls in 3 months, avg rank 2.57 |
New profiles usually start with small call counts. Rankings tend to move first, then calls follow as reviews and history build. Leander and Hartville show a fast start. Riverside and Huntsville show that larger, more competitive markets take longer. If you're planning a new office, set expectations accordingly, and use ads to cover the gap while the profile builds. See our Google Ads and LSA guide.
Results by market size
Market size changes what "good" looks like:
- Smaller markets like Grand Junction, Tanner and Staunton: a strong company can rank #1 across most of the map. King, Scout's Tanner office and Modern show what that looks like.
- Mid-size markets like Georgetown, North Canton and Granada Hills: top-three rankings across most of the grid are realistic with steady work, as Surge, State Termite and Bad Termite show.
- Big, dense markets like Queens and Orange County: each profile ranks well in a smaller radius, so the goal is to own your neighborhood and add real locations to cover more ground. MMPC and Cura show both approaches.
What the monthly numbers say about pest seasons
Stacked month by month, the reports show a clear seasonal pattern that every pest control owner will recognize:
| Client | May | Peak month | September |
|---|---|---|---|
| Cura | 391 | 641 (September) | 641 |
| King | 249 | 405 | 355 |
| Scout | 226 | 297 | 262 |
| Surge | 62 | 101 (July) | 93 |
| State Termite (Jun–Aug) | 53 in June | 90 in August | Not in report |
Calls climb from May into summer and stay high through late summer. Cura kept growing all the way to September, as its newer offices added calls. The practical lessons:
- Be ready before the climb. Profiles, pages and reviews built in winter and early spring are what capture the summer jump. Work done in June arrives late.
- Staff the phones for the peak. A month with 60% more calls than May is a month where missed calls cost the most.
- Push recurring plans in the busy months. Summer callers who sign up for a plan carry revenue through the slow season.
- Plan fall campaigns. Rodents and overwintering pests keep calls going after the summer peak if you're visible for them.
See the seasonal calendar in our pest control marketing ideas guide for how to plan around this.
What the results say about pest-specific marketing
The keywords in these reports are a reminder that pest control customers don't all search the same way:
| Search | Client | Result |
|---|---|---|
| "termite inspection" | Bad Termite, Granada Hills | #1 across the heart of the market |
| "termite inspection" | DeAnza (Cura), Temecula | 7.08 to 5.09 in about a month |
| "termite control North Canton" | State Termite | 2.38, 84% high |
| "termite control queens" | MMPC | #3, 3.7 avg |
| "rodent removal" | Modern Pest Control | 1.88 avg |
| "mice removal" | Modern Pest Control | 2.07 avg |
| "exterminator" | Surge, Georgetown | 2.89, 72% top 3 |
| "exterminator near me" | Scout, Tanner | 2.95, 72% high |
Termite searches show up again and again because termite work is high value and homeowners research it carefully. Rodent searches are urgent. "Exterminator" is how many people still describe the whole industry. A company that ranks for its main pests, not only for "pest control," catches more of the calls that matter. That starts with a dedicated page and Google profile service for each pest, as covered in our pest control SEO guide.
The same lesson shows up outside our client reports. In the video below, Bodhi audits Capture Pest Control, a Bergen County, New Jersey company doing about $107K a month, and finds the same gaps: a home page title aimed at the whole state instead of the county, service pages that weren't localized, reviews not connected to the Google profile, and no profiles in the nearby counties it serves. It isn't one of the clients on this page, so none of its numbers are here, but the fixes are the ones behind every result above.

How do you turn call counts like these into revenue?
Multiply calls by your booking rate, then by the share of booked jobs that become recurring plans, then by what a plan customer is worth over its life. Calls are the number we can measure for every client. Revenue depends on the owner's office, pricing and retention, which is why we don't publish it except where the owner has said it himself. Here's the math to run on your own company:
| Step | What to use | Where to get it |
|---|---|---|
| Calls from Google | Calls by location and month | Google Business Profile performance and call tracking |
| Booking rate | Booked jobs ÷ qualified calls | Recorded calls or your office's booking log |
| Plan conversion | Share of new customers who start a recurring plan | FieldRoutes, PestPac, GorillaDesk or your CRM |
| Plan customer value | Annual plan revenue × average years kept × gross margin | Your pricing and cancellation rate |
An illustration, not a client result: a location with 300 calls a summer, a 60% booking rate and 40% of new customers on a plan adds about 72 plan customers. If each is worth $1,000 or more in gross profit over its life, one season's calls from one profile are worth $72,000 or more in future gross profit, before one-time jobs and add-ons. Run the same math on Cura's 2,627 calls or King's 1,789 and it's clear why the profile and reviews deserve a real share of the budget. For the full budgeting method, see our pest control marketing budget guide.
What these reports don't include
To keep the numbers honest, it's worth saying what's outside them:
- Calls from other channels. Door-to-door sales, referrals, Yelp, direct mail and repeat customers aren't counted here. For companies like Surge and Cura, which knock doors, that's a large share of the business.
- Revenue for most clients. We report calls. Surge's revenue figure is owner-reported and covers all channels.
- Google Ads results. The call counts on this page come from Google profiles and Google call tracking in each report, not a separate ad performance breakdown.
- Every month of the year. Most reports cover May to September 2026, State Termite's covers June to August. Winter months are slower for most pest companies.
- Every client. This page covers the pest control clients with complete 2026 reports. Results for other clients and other industries are on our main case studies pages.
We'd rather show smaller, clearly defined numbers than inflate them by mixing sources.
What these results took from the owners
Marketing doesn't produce numbers like these alone. In every case, the owner and team carried a big part of it:
- Answering the phone. More calls only matter when someone picks up and books the job.
- Asking for reviews on every job. Technicians and office staff asking every customer is what keeps reviews steady.
- Opening real offices. New locations need staff, signage and real operations, not just a profile.
- Doing good work. Reviews and referrals follow service. No marketing fixes a bad customer experience for long.
- Sharing information. Owners who tell us about new services, staffing changes and slow weeks get better plans.
Lessons we've taken from these clients
The short version: new locations take patience, one strong profile can carry a company, and grid tracking is the only honest way to measure maps.
- New locations are a long game. Riverside and Huntington Beach had 14 and 9 calls in their first months. Leander had 140. Market size and competition matter, and patience matters more.
- One great profile can carry a company. MMPC produces about 140 calls a month from one profile in New York City.
- Specialists can win big with one search. Bad Termite owns "termite inspection" in its market.
- Grid tracking shows the truth. A company can look #1 from its office and be invisible a few miles away. Every result on this page is measured across a grid for that reason.
- Old activity isn't the same as results. Seth's experience with a previous agency's blog posts is a reminder to measure what work actually changes.
- Search and door-to-door work together. Surge and Cura both knock doors and rank on Google, and each channel makes the other stronger.
How to work toward results like these
If you want to build toward numbers like these, here's the order we'd follow, based on what these clients have in common:
| When | Focus |
|---|---|
| Month 1 | Set up call tracking and a grid baseline for your main keywords. Fix your Google profile: categories, services, service areas, photos and ownership. |
| Month 1–2 | Start the review routine on every job. Fix listings on Bing, Apple, Yelp and directories so details match. |
| Month 2–3 | Build or improve pages for your main pests and towns. Fix site speed and mobile issues. |
| Month 3–6 | Earn local links, publish seasonal guides, and run Local Services Ads or Search ads where the profile isn't strong yet. |
| Month 6+ | Review the grid by town. Where you're losing because of distance, plan a real second location. |
Results like these build over months of steady work, not in a single month. Steady execution is what compounds.
Questions to ask about your own company
Start with two numbers every client above can answer: calls from Google by location last month, and where on the map you rank in the top 3.
- Do you know how many calls your Google profile produced last month, by location?
- Where on the map do you rank in the top 3, and where do you disappear?
- How many new reviews did each location get last month, and does every customer get asked?
- Do you have a page and a profile service for every pest you want more of?
- Are there towns you serve where you're losing calls because you're too far away?
- What happens when someone calls after hours?
If you can't answer the first two, start there. Every client on this page can.
How we measure and report these results
Every number on this page comes from the reports we produce for clients. Here's what they measure and what they don't:
| Metric | Where it comes from | Limits |
|---|---|---|
| Calls from Google | Google Business Profile performance data and call tracking | Doesn't include calls from other sources, like door-to-door or referrals |
| Year-over-year change | The same months in the previous year | Affected by weather, staffing and service changes, not just marketing |
| Average map rank | A grid of points across the service area for one keyword | One keyword at a time, and rankings change daily |
| Top 3 or "ranking high" | Share of grid points where the client is in the map pack | Depends on grid size and spacing |
| Revenue (Surge) | Reported by the owner | Not independently verified, and includes all channels |
We report calls rather than revenue for most clients because calls are what we can measure directly. Owners know their close rates and job values, and they're the ones who can turn calls into revenue figures. If you want to learn how we'd measure your marketing, see how to choose a pest control marketing agency for what any good report should include.
In the owners' words
Numbers only tell part of the story. A few things our clients have said on camera with Bodhi:
- Seth Fenn, Cura Termite & Pest Control, on where his customers come from: "the SEO, our door knocking, and then obviously Yelp."
- Seth, on rankings: "we were on the second and third page. Now I'm in the map pack number one, and I'm on the first page."
- Forrest Jensen, Surge Pest Control, on adding another office: "I'm sure we'll get a third one."

How to read any agency's case studies
Whether you're looking at ours or anyone else's, a few questions help separate real results from marketing:
- Is the client named, with a real location you could look up?
- Is there a clear time period and a comparison, like year over year?
- Are the numbers calls and leads, or only impressions and clicks?
- Are rankings measured across a grid, or from a single point?
- Does the agency show small or still-building results too, or only the best?
- Can you talk to the client?
You can check any of the rankings on this page yourself by searching the keyword from the client's town. For the full system behind these results, see the pest control marketing guide.